


Creating a strict trading algorithm is the first step toward automated trading on financial markets. The next step (possibly the most important) is to introduce risk management rules and evaluate the system’s effectiveness based on historical testing. At the same time, it should be noted that these two blocks are undoubtedly connected: it is impossible to adjust the parameters of the trading system without verifying its robustness on historical data, but it is also necessary to initially set up correct system parameters for testing.

The logical chain can be broken forcibly or by creating self-learning modules (evolutionary algorithms, etc.). Nevertheless, in both cases, an obvious question arises: what volume of historical data is sufficient for setting up a stable trading system? How many bars are required to correctly optimize the system parameters and obtain a correct metric: profit/risk, acceptable risk ratio per trade, etc.?
Criteria for Evaluating the Quality of Testing a Trading Algorithm on Forex

Consider at least three criteria that are important to consider when determining the quality of the test of a trading strategy.
- Psychological significance. What volume of historical data is sufficient for a trader to feel confident in the trading strategy? 100, 1000 bars, or several tens of thousands? The answer to this question is subjective and depends on the trader’s psychological type.
- Continuity of market conditions. Significant changes in the market lead to inevitable changes in the profitability indicators of the system. Can you trade on the foreign exchange market according to a familiar scheme if a fixed currency corridor is canceled and a floating rate is introduced (for example, recall the national currency)? Definitely not, because the market properties have undergone sudden changes. However, historical testing implies a continuous approach. In this case, the mean reversion strategy loses efficiency, while the trend following strategy becomes a very attractive option.
- Stability of results. This criterion is possibly the key indicator, as it allows for obtaining the correct psychological setup and simultaneously detecting changes in the market structure in a timely manner. By stability, we will mean maintaining the trading system’s indicators with a small change in the history volume. Will the profit/loss ratio change significantly if 1% of the current historical data volume is added? If the answer is affirmative, the system’s stability is in question.
Empirical Profitability Test of the Strategy
Historical testing of a forex trading strategy allows for obtaining an empirical distribution of returns, which is a key parameter of the algorithm: average return, maximum drawdown can be obtained based on this distribution. Each return interval corresponds to a certain proportion of completed trades N1/N of their total number N.
If the full interval lies between -10% and 40%, then the empirical distribution of returns can be represented in the form of the following table:
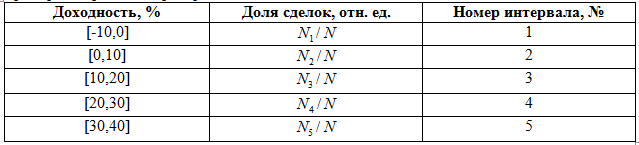
This table can be presented in the form of a graph showing the relationship between returns and the frequency of trades. Five return intervals were used, but the total number of intervals depends on the required accuracy of return determination. The efficient market hypothesis assumes that the curve should correspond to a normal ‘bell-shaped’ Gaussian distribution. However, the existence of long-term trends in the market disrupts this law and leads to the formation of ‘fat tails’.
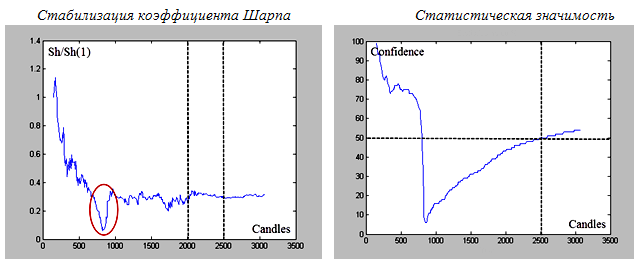
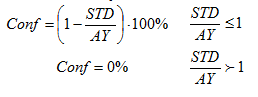
The classical approach to describing a normal distribution usually means using two parameters: standard deviation/variance (STD) as a measure of risk and average return (AY). The ratio AY/STD characterizes the profit per unit of risk and is defined as the Sharpe ratio in standard portfolio theory. Stability of the trading system requires stability of this parameter.
Stabilizing the Algorithm’s Performance Using a Volatility Model

Let’s consider the stabilization effect using a classic volatility model: “Inside Day.” The pair candlestick model is marked by a rectangle on the figure at the bottom left. The range of the second daily candle is within the range of the first candle’s volatility: the trading idea is to look for a breakout of volatility on large volumes. It is proposed to place two pending buy stop/sell stop orders near the corridor boundaries. Both orders can be activated. Stop loss orders are placed near the opposite boundary of the corridor. When one of the orders (buy stop, or sell stop) is triggered, the opposite order is canceled – the market has chosen a direction.
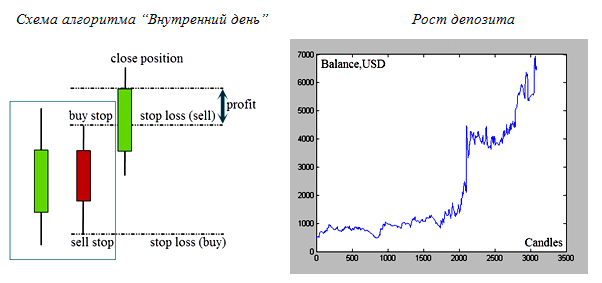
The position is closed at the end of the trading day upon completion of the candle formation.
Since only four values Open/High/Low/Close are used, there may be a situation where the range of the third candle (breakout candle) goes beyond the previous day’s range. In this case, the worst-case scenario is assumed – a loss. This preliminary pessimistic assessment gives worse results than real trading results. However, we do not need to use tick history, which significantly simplifies the testing conditions.
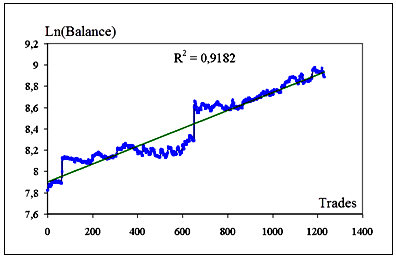
The historical test was performed in the MatLab 6.5 software package based on historical quotes from IFC Markets broker, taking into account the corporate fixed spread of 2 points and swaps (-0.28/-0.41 for long/short). Results are provided for the GBP/USD currency pair on daily candles for the period April 2002 – July 2014. Each trade involves a risk of 5% of the deposit and absolute capitalization of profits
FAQ
What is the importance of historical data in forex trading strategy evaluation?
Historical data is essential for testing and optimizing a trading strategy, as it allows traders to assess performance under various market conditions and determine the stability of key metrics like profit/risk ratios.
How does market condition continuity affect trading strategies?
Changes in market conditions, such as shifts from fixed to floating exchange rates, can significantly impact a strategy’s effectiveness. Strategies that work under one market structure may fail when conditions change.
What is the role of volatility models in stabilizing trading algorithms?
Volatility models, like the ‘Inside Day’ approach, help stabilize algorithmic performance by defining entry and exit points based on price ranges, reducing risk and improving consistency in trade execution.


