As per our training course plan, it’s time to move on to studying technical indicators and their application. However, recently I came across an interesting chart that made me return to the topic of classical technical analysis, specifically the pattern of uncertainty — the figure Triangle.

The Reversal Power of the Symmetrical Triangle
Analysts and market trainers are often accused of showing only historical summaries. Today we have the opportunity to observe the symmetrical triangle pattern in motion.
There are articles available online that justify the reversal power of the symmetrical triangle for Russian popular stocks. I’ve been familiar with these patterns for a long time, since December 2007. At that time, the classic interpretation of these patterns led me to buy Gazprom shares at 358 rubles. Of course, I had stops, but it was a useful lesson: it not only changed my view on these patterns but also shaped a specific approach to technical analysis.
Specifically, the symmetrical triangle, which consists of five waves, warns me about a trend reversal, contrary to the classic scenario from books. I don’t leave the thought of a reversal until the stock passes the peak/trough of the first wave. Therefore, when I encountered the symmetrical triangle on the young shares of Alrosa, I decided to take a closer look and add this pattern to my collection, tracking the movement of the price.
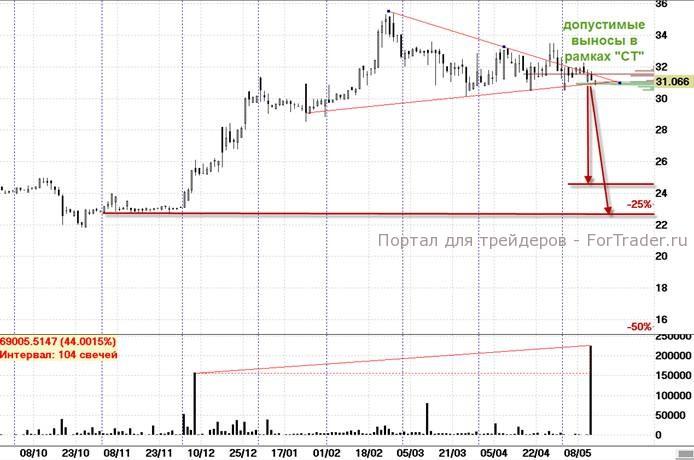
After thinking, I realized that my well-known symmetrical triangles were formed cleanly. The entry into them was after clear trends. However, the triangle on Alrosa seemed to be melted from the head and shoulders pattern. The head and shoulders couldn’t break through the neckline and now promises a return, at least, to annual peaks. So, should we cross out the scenario and draw the ‘Hound of the Baskervilles’? Let’s keep it simple: mark the resistance of the triangle and watch it — 31.4 rubles.
So, breaking the triangle’s resistance suggests a move, at minimum, to the annual peak, and at maximum, could realize the ‘Hound of the Baskervilles’ effect and send Alrosa’s prices to around 41 rubles. Breaking the triangle’s support suggests a drop, at minimum, to the support level of 25 rubles (height of the triangle base) and 23 rubles (start of the first wave of the triangle).
Using the MICEX Index Chart as a Clue
Similar configurations were recently seen on the MICEX index charts. It should be noted, however, that the triangle here is not a symmetrical one, but a descending one after an upward trend.
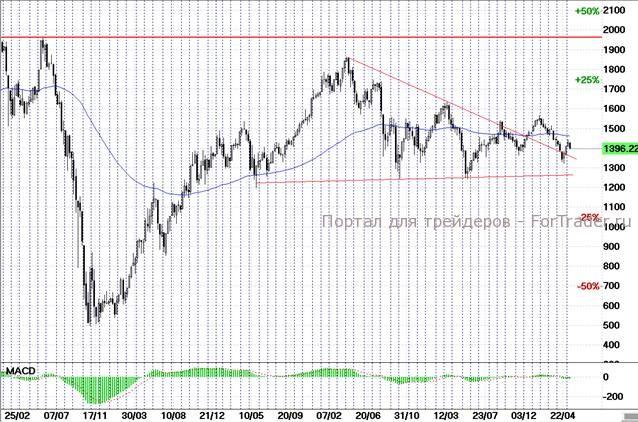
The MICEX index chart can serve as a clue for us, showing how similar configurations may work out. Here, it’s evident that the positive scenario for ‘bulls’ isn’t developing quickly, even with technical advantages. Therefore, if everything resolves in favor of the resistance breakout, it’s necessary to have some time reserve when buying Alrosa shares. Time filters on the resistance breakout should be sufficiently large, I think it’s reasonable to increase them to five trading sessions. If you’ve already placed ‘stop orders’ below the triangle’s support, then time cannot be played with. Stops must be mechanical with minimal protective time — 5-10 minutes.
I think you’ve guessed what your homework is — you need to watch the triangle on Alrosa! But I would like to add another recommendation to search for configurations similar to the one we saw on the MICEX index and their development on other stocks.
Other Articles on Technical Analysis Patterns
- Technical Analysis Patterns – Symmetrical and Expanding Triangles
- Flags and Pennants: Characteristics of Pattern Analysis
- New Perspective on Technical Analysis Patterns
- Expanding Formation – A Pattern That Teaches Not to Relax
- Trend Reversal Pattern Diamond or Rhombus: A Dangerous Signal for Traders
“,
“excerpt”: “How to trade using the triangle pattern on the stock market? Specifics of using the pattern on the Russian stock market.”,
“slug”: “triangle-or-head-and-shoulders-technical-analysis-patterns”,
“short_description”: “How to trade using the triangle pattern on the stock market? Specifics of using the pattern on the Russian stock market.”,
“faq_html”: “
FAQ
What is a symmetrical triangle in technical analysis?
A symmetrical triangle is a chart pattern that indicates a period of consolidation before a potential breakout in either direction.
How do traders use the triangle pattern?
Traders use the triangle pattern to identify potential breakout points and set stop-loss or take-profit levels based on the pattern’s structure.
What does a breakout from a triangle pattern signify?
A breakout from a triangle pattern typically signifies a continuation of the previous trend, although it can also indicate a reversal depending on the context and other technical indicators.
”