


Continuing our introduction to graphical technical analysis, in the previous article we discussed large formations—trend reversal patterns. Today I will explain the characteristics of analyzing trend continuation patterns—’Flags’ and ‘Pennants’.
Flag and Pennant Patterns: A Difficult Sideways Movement
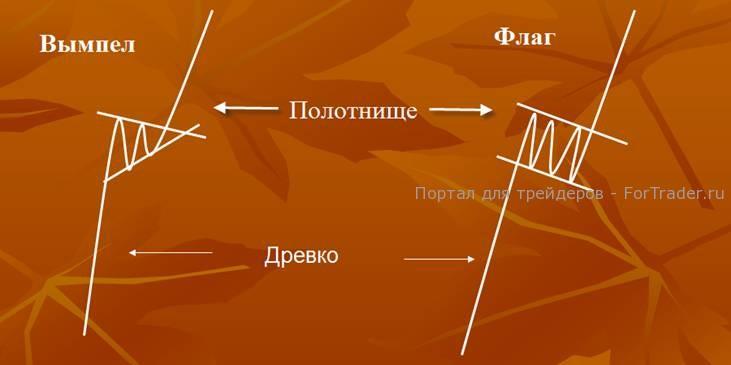
Flag and Pennant patterns can form after both an uptrend and a downtrend. Often there is confusion about interpreting these technical analysis patterns, as they are easy to mix up during their formation. I never try to determine on a live chart at the moment whether it’s a ‘Flag’ or a ‘Pennant.’ I rely on the philosophy behind the formation of these patterns. ‘Flag’ or ‘Pennant’ is a small, boring sideways movement where the stock rests from the previous move and gathers strength for a new trend.


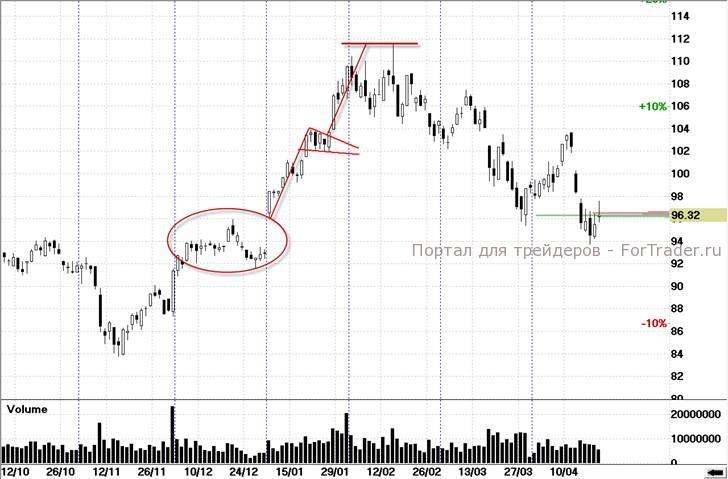
Flag or Pennant patterns are not just a foundation for future movement; they are a graphical representation of trader uncertainty. That is why the formation of these patterns often occurs with reduced trading volume. And to better see ‘Flags’ and ‘Pennants,’ remember the classic representation of them, including that a consolidation should precede them.
The Pole of the Pattern – Not a Problem
There is another characteristic of forming ‘Flag’ and ‘Pennant’ patterns on charts of domestic securities. Sometimes it is difficult to determine where the pattern begins and ends. Take the pole as an approximate guide, and there will be no problems. Since Russian stocks are very volatile, sometimes the pole may consist of one candle. But this candle should be a so-called ‘long day,’ meaning it should be significantly larger than the candles showing recent movements.
Sometimes ‘Flags’ and ‘Pennants’ stretch out over time, making them easy to confuse with independent channels. In such cases, I use time frames. Through experience, I found that ‘Flags’ and ‘Pennants’ that actually signal trend continuation often have 5, 8, 13 candles in the ‘sail’ structure. Did you recognize it? Yes, the mystical Fibonacci numbers appeared here as well.
‘Flags’ and ‘Pennants’ are often encountered during intraday trading, so practice and look for these continuation patterns on popular Russian stocks on hourly, thirty-minute, and fifteen-minute charts. I am sure that this practice will help you see many interesting and profitable trading opportunities!
Other articles about technical analysis patterns
- Head and Shoulders: Construction Features and Trading on Forex
- Trend Reversal Pattern Diamond or Rhombus: A Dangerous Signal for Traders
- Trend Continuation Pattern The Hound of the Baskervilles – An Unsuccessful Head and Shoulders
- Cup with Handle – A Profitable Pattern of an Uptrend Continuation
- Triangle or Head and Shoulders? A Little More About Technical Analysis Patterns
FAQ
What are Flag and Pennant patterns?
Flag and Pennant patterns are trend continuation patterns that indicate a pause in the current trend before it resumes.
How do I distinguish between a Flag and a Pennant?
A Flag typically has a rectangular shape, while a Pennant has a triangular shape, both forming during a period of consolidation.
Why are Fibonacci numbers important in these patterns?
Fibonacci numbers often appear in the structure of these patterns, helping traders identify potential price targets and continuation points.


