Continuing our systematic study of methods for analyzing stock market quotes on the Russian financial market. Last time, we discussed how to profit when dealing with a sloping channel. Now let’s discuss the opportunities for capital growth if a technical analysis pattern appears on the chart. Technical analysis patterns are stable patterns that predict a change or continuation of market movement.

Let’s figure out who would benefit from classical technical analysis for studying patterns?
For me, the answer to this question is obvious. Classical technical analysis is an ideal option for those who do not want to work hard and create a complex system based on indicators and risk management, and are ready to sacrifice the opportunity to make super profits.
Stepping Away from Classic Patterns
Before delving into patterns, and especially before trading based on them, it is important to consider the characteristics of pattern formation on Russian charts:
- Strict proportion of the trend to the pattern – not mandatory.
- Patterns are clearly visible, so there is an opportunity for quality execution in the first 40 stocks ranked by annual trading volume.
- Patterns formed on periods less than one day overlap with emotional points of the trading session, which occur during the opening of European and American markets, and the release of weekly news.
Usually, when I show advanced traders a popular technical analysis pattern on lectures and ask, “Friends, what will we do?”, traders immediately respond according to their strategy. Some say they urgently close long positions, others claim it’s already time to be in short positions. I like the mobility of their decisions, but still – I give them all a ‘two’ in my mind. Before acting, you need to calculate whether this is a significant pattern for your security? Because the wisdom of centuries of trading, described in classical technical analysis works, may not be applicable or may have some exceptions for certain securities. To be ahead of the crowd, study the statistics of pattern effectiveness on your charts.
Studying Statistics
This is a rather labor-intensive process, so allow me to give a few tips to make it easier.
It is very important to prepare in advance, during which:
1. Define criteria for pattern significance:
– timeframe;
– duration of formation;
– unique features.
2. Conduct a reconnaissance – perform a visual inspection of the charts.
3. Compile summary data on sector stocks.
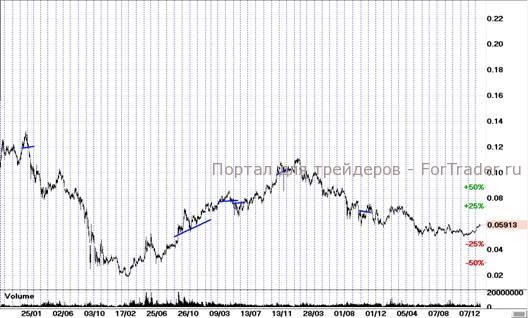
Next, define the criteria for selecting patterns and the criteria for calculations. For example, let’s examine the popular technical analysis patterns “Head and Shoulders” (H&S) and “Inverse Head and Shoulders” (Inverse H&S) on the daily chart of “VTB”. I chose VTB shares not for the simplicity of calculations, but because for such young securities, it is very important to accumulate exclusive knowledge.
Pattern selection criteria:
Select only patterns:
– The trend before entering was at least 10%;
– Existed on the market for at least 2 months;
– With a classic neck line and shoulders, not coinciding with the peaks/troughs of the head;
– Exclude trading volume readings.
Calculation criteria:
The main reference point is the neckline breakout point.
We conduct a simplified review: did the pattern appear according to the classical canon or the “Hound of the Baskervilles” effect. The “Hound of the Baskervilles” effect means that if prices do not go where the canonical representation of the pattern prescribes, then they get double potential to move in the opposite direction. The law applies to both continuation and reversal patterns.
Summary
On the VTB chart, there were six patterns that met our parameters: 4 “H&S” and 2 “inverse H&S”. Three H&S patterns appeared according to the classics on average at 70% of the height of the head. One pattern fulfilled the “Hound of the Baskervilles” effect. Inverse H&S did not contain a full reversal and were on average executed at 37.5%.
What does this research give us? Now, when analysts and traders will shout in reviews and forums that an H&S pattern has formed on VTB, we will know that the potential for decline is not as great as prescribed by classical canons. While traders wait for the continuation of the decline, holding short positions, we can look for purchases when the shares draw down 70% of the height of the head. Based on the calculated results, we definitely won’t expect a strong rise after the appearance of an inverse H&S.
Remember that the result of any research should generate an idea for a new research. Always record additional conclusions.
Additional conclusions in our example – during the research, it was found that H&S and inverse H&S patterns often appear on VTB shares with non-classical neck lines.
FAQ
What are technical analysis patterns?
Technical analysis patterns are stable formations that predict changes or continuations in market movements.
How do I identify these patterns?
Identify patterns by analyzing price charts, considering factors like trend, formation duration, and unique features.
Why is it important to study pattern statistics?
Studying pattern statistics helps determine the effectiveness of patterns for specific securities, allowing for more informed trading decisions.