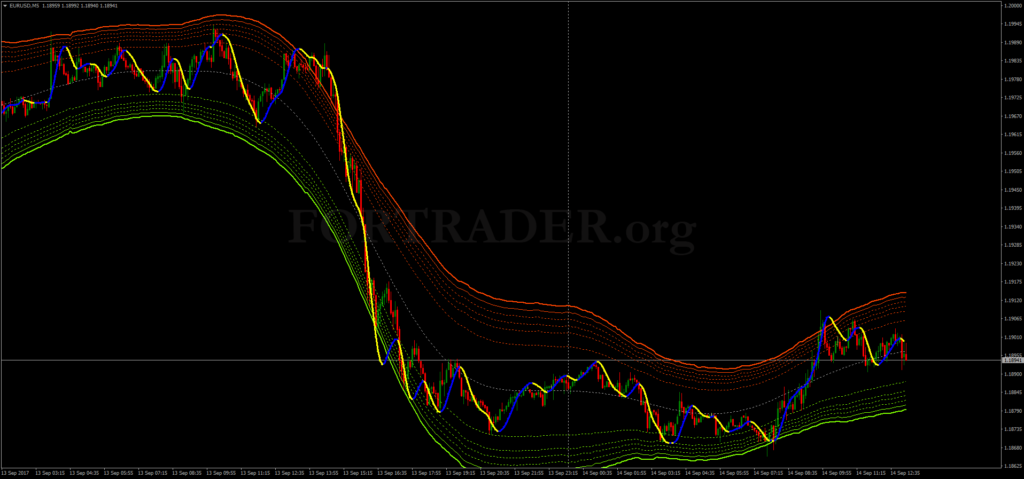
List of the different types of Bollinger Bands indicator.
Bollinger Toucher aa
Indicator isn’t repainted.
Download


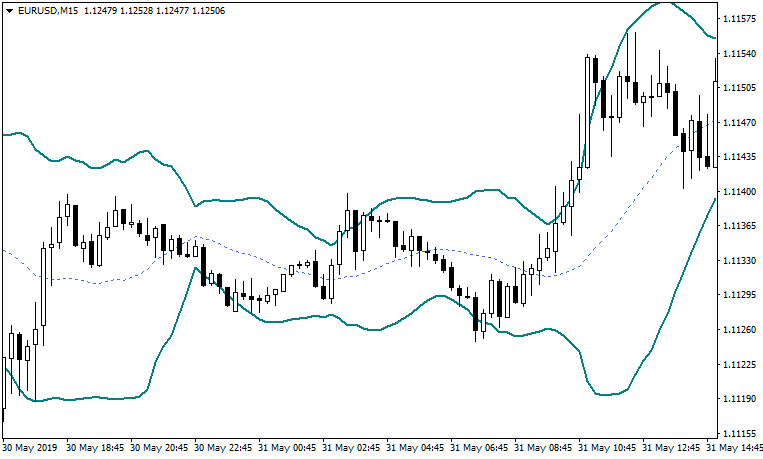
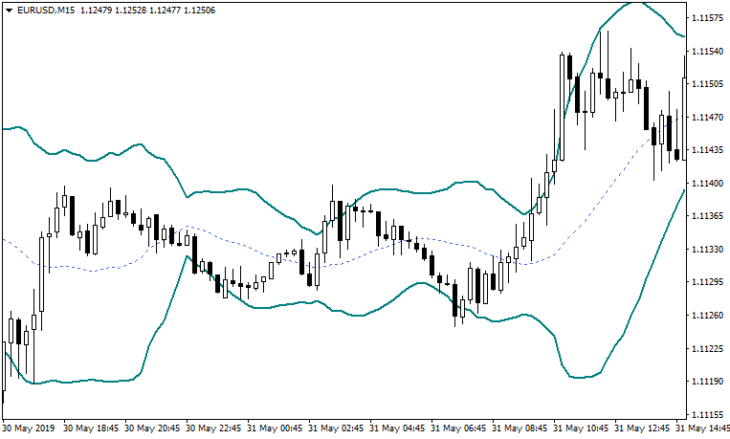
List of the different types of Bollinger Bands indicator.
Indicator isn’t repainted.
Download

The Moving Average Convergence Divergence (MACD) is a technical indicator which simply shows the relationship of exponential moving averages (EMA). The MACD displays a MACD line (blue), signal line (red) and a histogram, showing the difference between the MACD line and the signal line. The indicator was developed in 1970 by Gerald Appel to signalize changes in the […]
Chaos theory is the concept that came to Economy and gained positions among different economists and financial analysts. One of the main popular chartists who used this theory to create his own indicators is Bill Williams. In his book ‘Trading Chaos. Maximize Profits with Proven Technical Techniques he describes the trading system by using combinations […]
The Parabolic Stop and Reverse, more commonly known as the Parabolic SAR, is a trend following indicator developed by J. Welles Wilder. The Parabolic SAR is displayed as a single parabolic line (or dots) underneath the price bars in an uptrend, and above the price bars in a downtrend. The indicator has three primary functions: […]
List of the different types of Bollinger Bands indicator. Bollinger Toucher aa Indicator isn’t repainted. Download More BB indicators Bollinger bands for RSI – composite trend indicator RSI – averages + Bollinger bands (lines + alerts + arrows + mtf) – trend indicator bb stops stochastic (mtf + alerts) – modified Bollinger Bands