


The Parabolic Stop and Reverse, more commonly known as the Parabolic SAR, is a trend following indicator developed by J. Welles Wilder. The Parabolic SAR is displayed as a single parabolic line (or dots) underneath the price bars in an uptrend, and above the price bars in a downtrend.
The indicator has three primary functions:
- Highlighting the current price direction (trend).
- Providing potential entry signals.
- Providing potential exit signals.
Each of these applications is discussed in further detail below.
How to use PSAR
The basic use of the Parabolic SAR is to buy when the dots move below the price bars (signaling an uptrend) and sell/short-sell when the dots move above the price bars (signaling a downtrend).
This will result in constant trade signals, though, as the trader will always have a position. That can be good if the price is making big swings back and forth—producing a profit on each trade—but when the price is only making small moves in each direction, these constant trade signals can produce many losing trades in a row.
Therefore, it is better to analyze the price action of the day to determine if the trend (if there is one) is up or down. Another indicator such as a moving average or trendlines can also be used to establish the overall trend direction. If there is a trend, only take trade signals in the direction of the overall trend. For example, if the trend is down (based on your analysis), only take short trade signals—when the dots flip on top of the price bars—and then exit when the dots flip below the price bars.
Therу are a lot of types of Parabolic SAR from traders. We collect the best variants of this indicator.
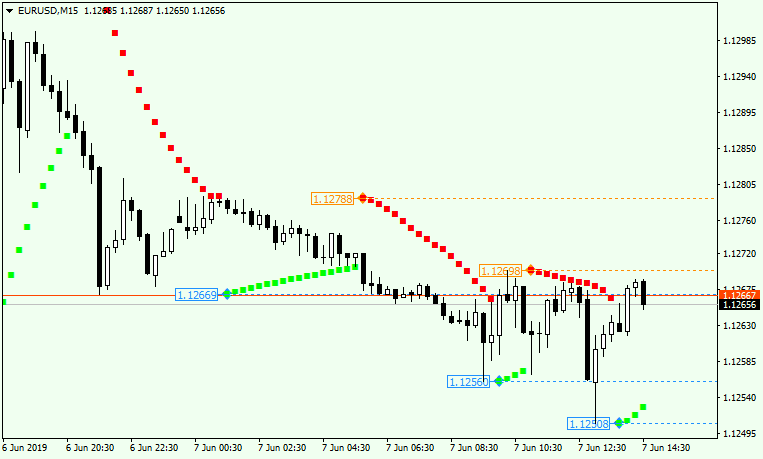
Brooky PSAR Levels from Tankk
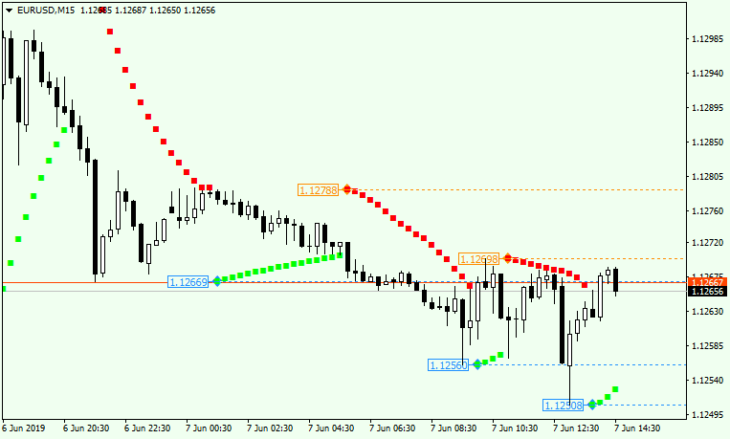
The indicator added levels that show when there was a trend reversal. They can be used as support and resistance levels.
Download
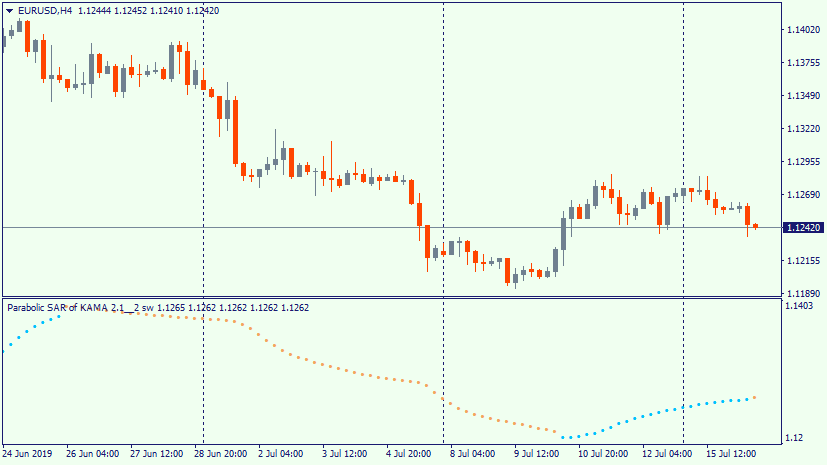
Parabolic SAR of KAMA – variation of parabolic indicator
Parabolic SAR of KAMA is a variation of parabolic indicator displayed in a separate window. It works as a reversal indicator, showcasing the point of the trend change and the lasting of the current trend. The strength of the trend is not displayed, the indicator is graded at the current trading prices.