

Chaos theory is the concept that came to Economy and gained positions among different economists and financial analysts. One of the main popular chartists who used this theory to create his own indicators is Bill Williams. In his book ‘Trading Chaos. Maximize Profits with Proven Technical Techniques he describes the trading system by using combinations of Alligator indicator; Awesome oscillator and Bill Williams’ fractals.
How it works?
Alligator indicator – these are three moving averages, which are moved into the future. These moving averages have their own names. The fastest moving average with the period 5 and which is moved forward by 3 bars is called ‘lips’; the moving average with the 8-th period, moved forward by 5 bars is called ‘teeth’; the slowest one has the period 13 and it is moved forward by 8 bars – it is called ‘jaws’.
Signals of Alligator
The signals which the traders get from the indicator are the following:
-
Trend scanner
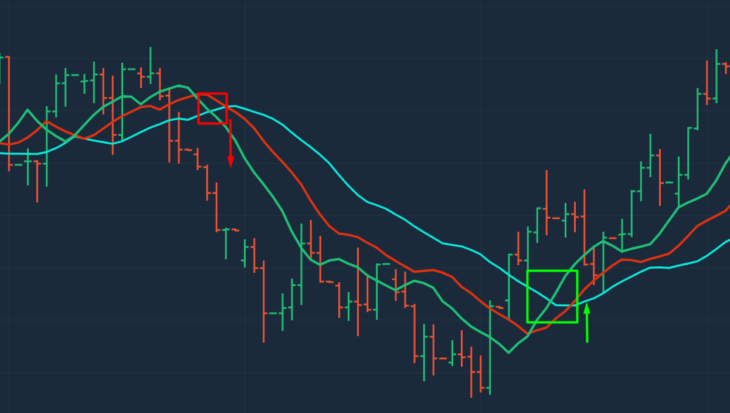
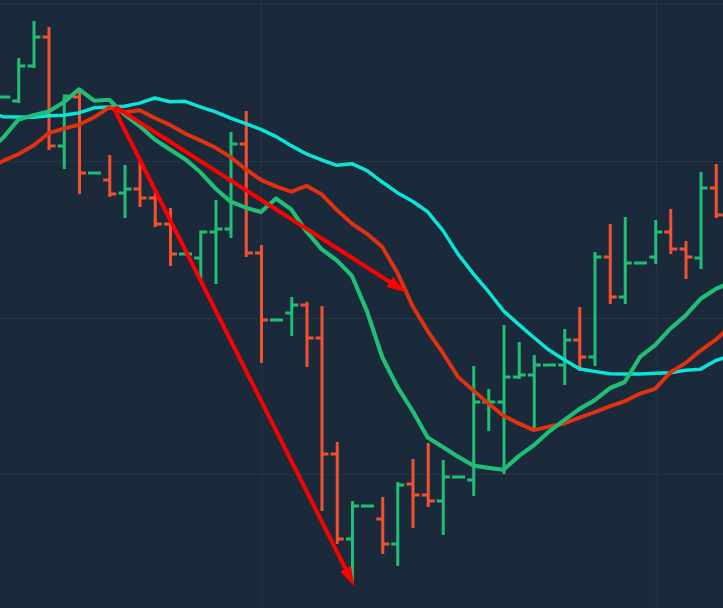
Owing to the indicator’s nature (moving averages) the very first type of signal is trend. The indicator helps to define the trend – if it rises – the trend is bullish – time to buy. If it goes down – the trend is bearish – time to sell. If the indicator is moving sideways – the market is in flat. It’s better to refrain from using indicators of tendency and include in your trading systems oscillators.
Williams suggested to use the following analogy: when the indicator is rising or falling down the mouth of the Alligator is opened and the indicator ‘eats’ prices. Meanwhile when the indicator is moving sideways – lines are intertwining – the alligator is ‘sleeping’.
-
Reversal signals
The main line in Alligator indicator is the ‘teeth’ line. It is usually situated in the middle (between ‘lips’ and ‘jaws’). Williams suggested to find angulation between ‘teeth’ line and a divergent bar (a bar that must have lower low than the previous bar and must close in the upper half for bullish markets; a bar that must have higher high than a previous bar and must close in the lower half for bearish markets).
As you can see the angulation helps to find reversal signals.
-
Buying and selling signals
Alligator indicator usually is not being used alone. Traders are using Alligator along with Fractals and Awesome oscillator. But it doesn’t mean that we cannot use all these three technical tools separately.
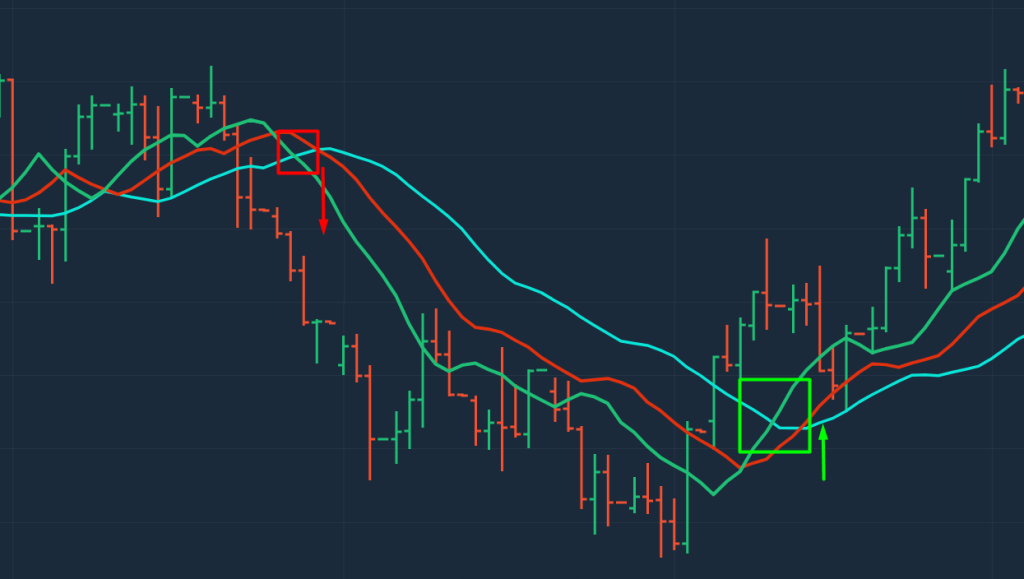
We get signals from Alligator when the fastest line (‘lips’) breaks the slowest (‘jaws’). If ‘lips’ breaks ‘jaws’ upwards – this is a signal to buy, otherwise – this is a signal to sell. It’s impossible to use these signals on flats.