


The Moving Average Convergence Divergence (MACD) is a technical indicator which simply shows the relationship of exponential moving averages (EMA). The MACD displays a MACD line (blue), signal line (red) and a histogram, showing the difference between the MACD line and the signal line.
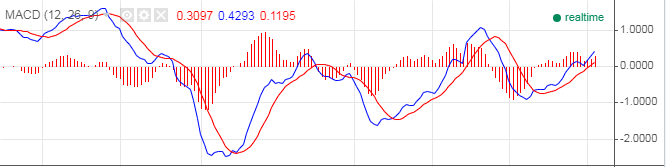
The indicator was developed in 1970 by Gerald Appel to signalize changes in the direction, momentum and the strength of the Forex trends.
MACD is a lagging indicator, which means that its signals appear after the event has begun on the chart. In this relation, the tool has trend-confirming character.
MACD lines
The MACD line is the difference between two exponentially leveled moving averages – usually 12 and 26-periods This is the most important component of the indicator. The MACD line is the faster line of the indicator..
- MACD line = 12 EMA – 26 EMA
- Signal line = 9 EMA
- Histogram = difference between MACD line and signal line
These MACD lines waver in and around the zero line. This gives the MACD the characteristics of an oscillator giving overbought and oversold signals above and below the zero-line respectively.
MACD signals
The MACD crossover
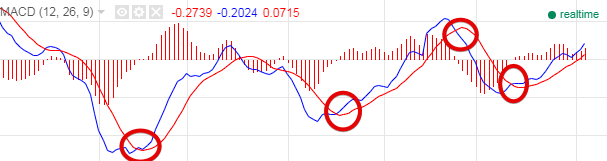
The MACD crossover is the most popular signal related to the indicator. It involves the intersection of the two lines. In this relation, we recognize two types of MACD crossover:
- Bullish MACD Crossover comes when the MACD line crosses the Signal Line in the bullish direction. This signal alerts that the price of the Forex pair is likely to increase.
- Bearish MACD Crossover comes when the MACD line crosses the Signal Line in a bearish direction. The bearish MACD cross indicates that the price of the Forex pair is likely to decrease.
MACD Divergence
The the most powerful signal that MACD can give is a divergence pattern, signalling a primary or intermediate reversal in trends. A divergence pattern occurs when the price is continuing to form higher highs and higher lows, while the MACD Histogram shows a declining bullish momentum. Vice versa, a divergence pattern can also occur when the price is forming lower highs and lower lows, while the MACD Histogram is showing a diminishing bearish momentum.
Authors indicators based on MACD
FNCD
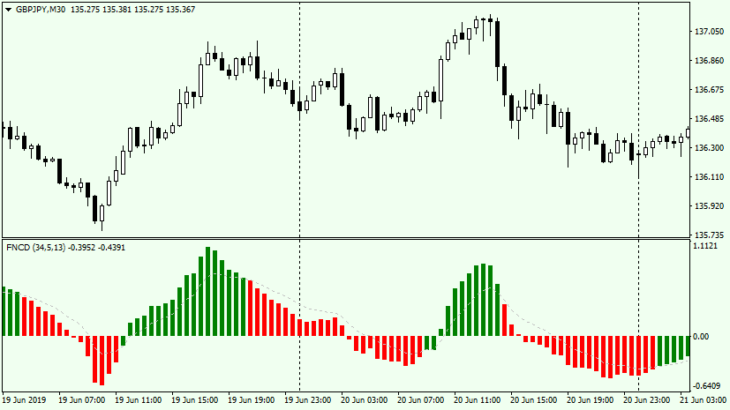
FNCD is an alternative to the MACD. Accordingly, trading with it is possible by a similar signal:
- crossing zero level
- change the color of bars
- divergence
Download
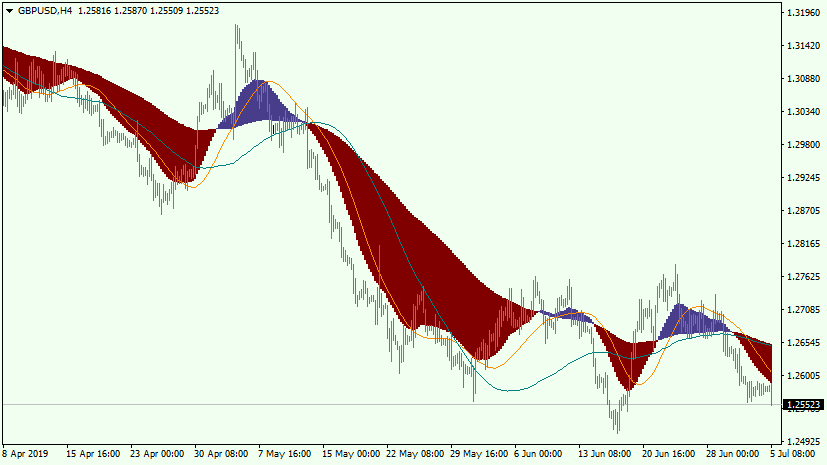
Visual MACD
MACD is one of the most popular indicators on the Forex. Visual MACD is another version displayed directly on the price chart. Trading is carried out in accordance with changes if bars’ colors. Closing the trade is made when moving average left the «cloud» area. You are free to choose your own trade tactic using this indicator and include it in your trade strategy.