


The higher quality of averaging (smoothing) of the indicator is associated with its higher noise immunity, that is, a significant reduction in the rapid pulsations of the smoothed indicator line.
RAMA vs. SMA
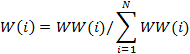
The technical indicator RAMA (weighted moving average) developed by the author of the article is proposed for practical use in trading, with an averaging (smoothing) period equal to N and a weighting function W (solid line), which is shown in Figure 1 (the calculation was done with a smoothing period N=20 bars).
![]()
For comparison, the uniform weighting function of smoothing (dashed line) of the classic SMA indicator is also shown in Figure 1, with a smoothing period equal to 20 bars.
It can be seen that the weighting function W has a significantly non-uniform character, with larger weights (higher values of W) assigned to current price values during averaging. In this case, it is usually concluded that the time delay (lag) introduced by the smoothed line formed by the smoothing indicator RAMA is reduced compared to the original price time series.
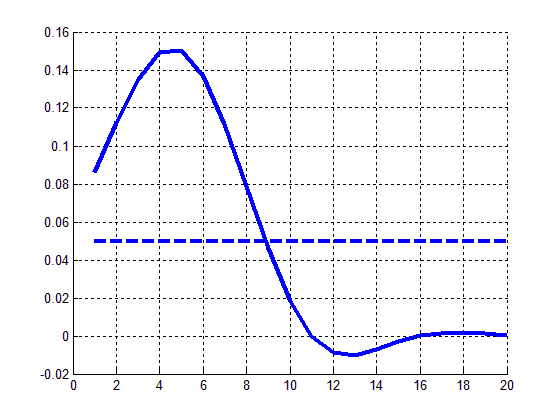
The conclusion about the reduced time delay (lag) introduced by the RAMA indicator compared to the time delay (lag) of the SMA indicator is reflected in Figure 2.
Solid line – smoothed output of the RAMA indicator (20), dashed line – smoothed output of the SMA indicator (20). In this example, the smoothing period N=20.
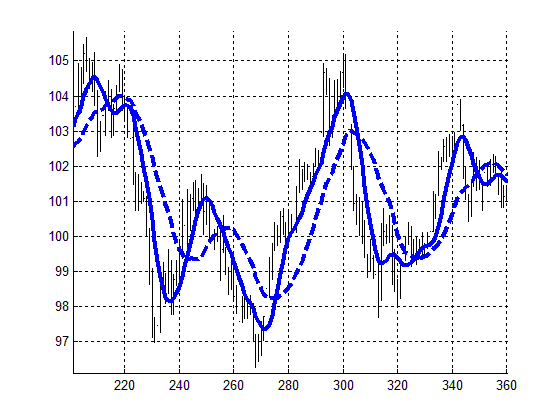
If the smoothing period N for the RAMA indicator is increased, while keeping the smoothing period for the classic SMA indicator unchanged, the time delay introduced by the RAMA indicator will also increase as the smoothing period N increases. For example, in the case shown in Figure 2, the smoothing period N for the RAMA indicator is increased by 2.5 times, i.e., to N=50, while the smoothing period N for the SMA indicator remains at 20. The result is shown in Figure 3.
We can see that the smoothed (averaged) lines obtained using the RAMA(50) and SMA(20) indicators coincide in this case, but the quality of smoothing (averaging) of the RAMA indicator is higher than that of the SMA indicator.
A conclusion can be made that using the RAMA indicator results in a higher quality of smoothing (averaging) compared to using the classic SMA indicator, while maintaining the same amount of time delay (lag).
Examples of the RAMA Indicator
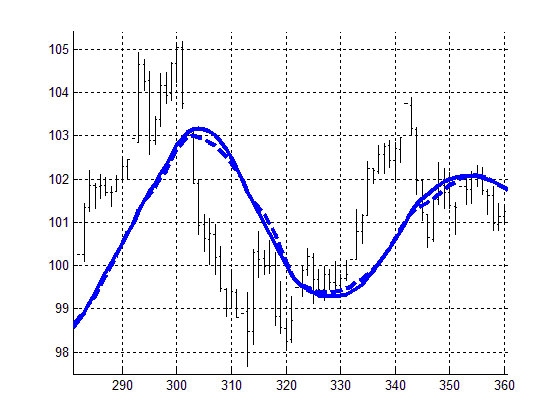
Figures 4-7 show examples of the application of the RAMA and SMA indicators for smoothing purposes. The smoothing periods (N) for the SMA indicator (dashed line) are 9, 26, 100, and 200, respectively, following Figures 4-7. Meanwhile, the smoothing periods N for the RAMA indicator (solid line) are increased by 2.5 times and are therefore equal to N=23, 65, 250, and 500 (the number N=23 is obtained by rounding up the product of 9*2.5=22.5 to the next whole number).
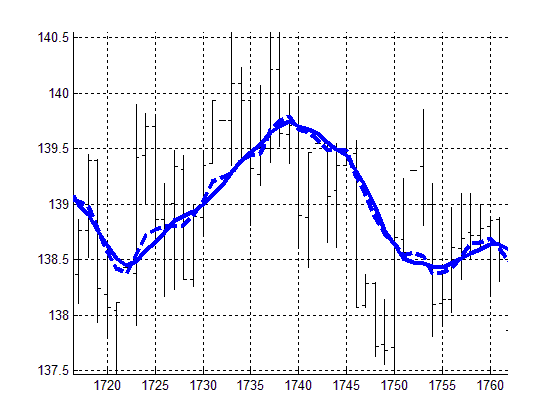
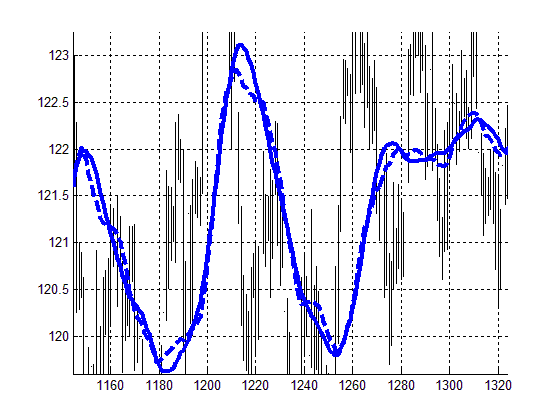
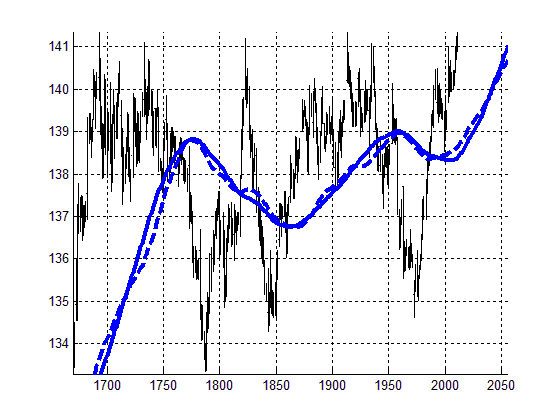
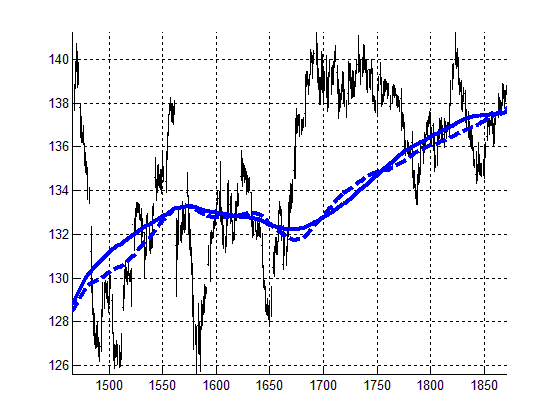
As seen from the figures, the smoothing (averaging) indicator RAMA, proposed by the author for practical use, provides a higher quality of averaging (smoothing) compared to the technical indicator SMA. The higher quality of averaging (smoothing) is associated with higher noise immunity, that is, a significant reduction in the rapid pulsations of the smoothed line of the RAMA indicator compared to the SMA indicator.
Calculation of the Modified Moving Average RAMA
The technical indicator RAMA(N) is easy to use, with one adjustable parameter – the smoothing period N, similar to the SMA(N) indicator.
The calculation of RAMA(N) with the smoothing parameter N is performed according to the expression:
![]()
Here,
- RAMA(N)t – the current (last) calculated value of the RAMA(N) indicator with the current index t.
- W(i) – a sequence of weights (values) of the weighting function W (Figure 1), where i varies from 1 to N, and N is the smoothing parameter of the RAMA(N) indicator.
- P(t-(i-1)) – a series of recent price values for smoothing (a total of N price values), for example, a series of N last close values (t-(i-1)).
The calculation of the sequence W(i) of weights (values) of the weighting function
FAQ
What is RAMA and how does it differ from SMA?
RAMA (Weighted Moving Average) uses a non-uniform weighting function that gives more weight to recent prices, reducing lag compared to the uniform weighting of SMA.
How does RAMA affect time delay compared to SMA?
RAMA reduces time delay when using the same smoothing period, but the delay increases as the smoothing period (N) increases, similar to SMA.
Can RAMA provide better smoothing than SMA?
Yes, RAMA offers higher noise immunity and smoother lines compared to SMA, especially when its smoothing period is adjusted proportionally to SMA’s period.


