The use of the technical RASL layer indicator is an opportunity to represent the complex dynamics of quote signals as a set of simpler (band) components.
The RASL Indicator – Idea and Application
![]()
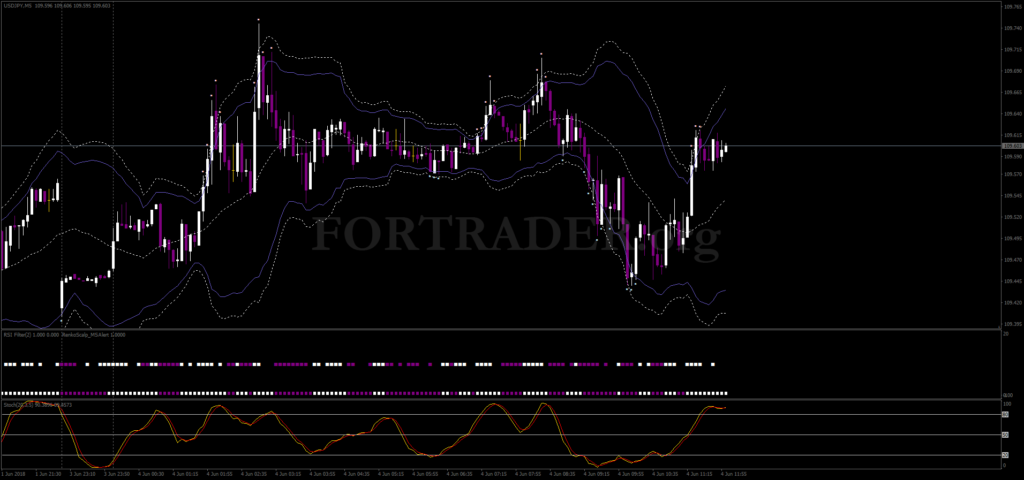
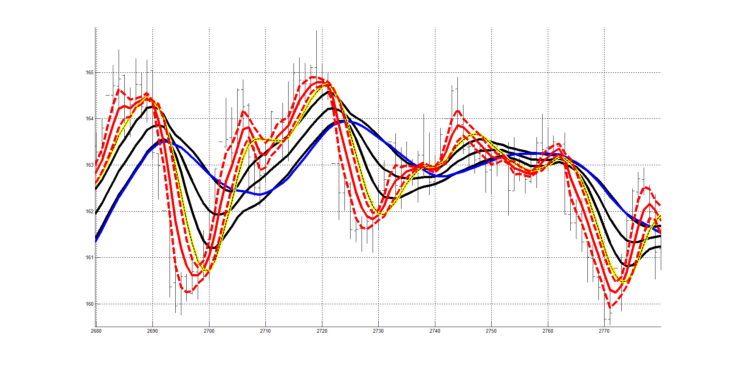
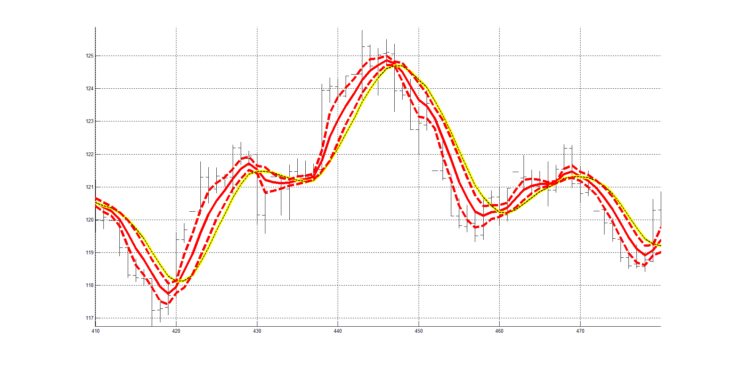
It is proposed for practical use in trading, a technical RASL layer indicator developed by the author of the article. An example of the RASL indicator for the layer of oscillations of quote signals enclosed within the interval from 4 periods to 20 periods is shown in Figure 1.
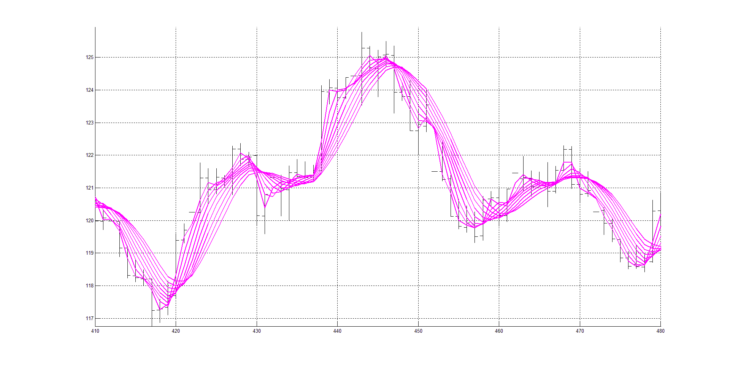
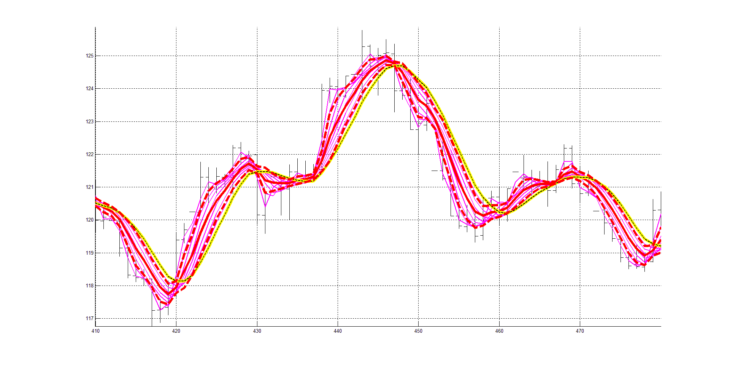
The stages of building the RASL layer indicator are shown in Figures 2 and 3.
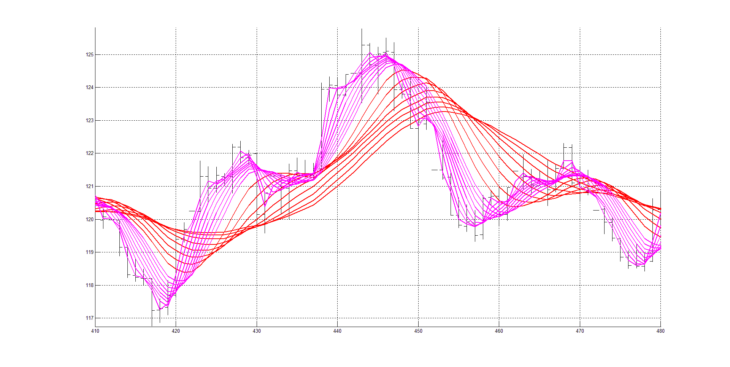
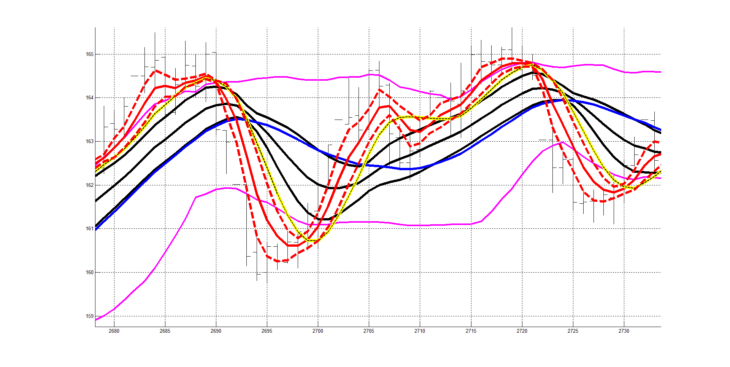
Figure 2 shows nine RAMA moving averages with smoothing periods from 4 to 20 with a step of 2 (4, 6, 8, 10, 12, 14, 16, 18, 20).
Indicator Algorithm
The technical indicator “RAMA Moving Average” is described in detail in a previously published article “Improving the Smoothing Quality Using the RAMA Technical Indicator”.
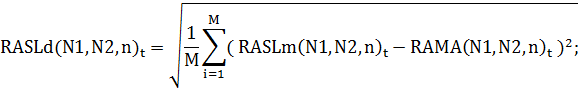
Next, calculate the average value for each current moment t across all RAMA values (N)t, where N ranges from 4 to 20 with a step of 2. Also, calculate the standard deviation (SD) (square root of variance) for each current moment t across all RAMA values (N)t, where N ranges from 4 to 20 with a step of 2.
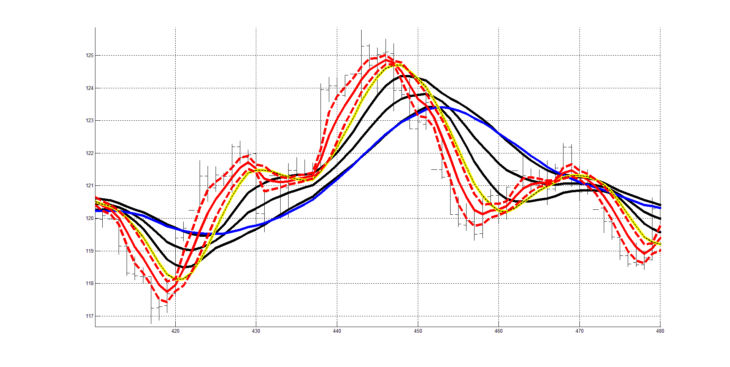
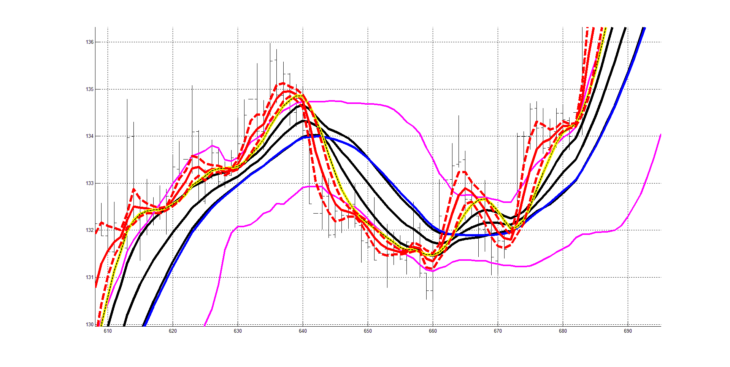
Figure 3 shows the original 9 RAMA moving averages (Figure 2), also a red line drawn as the average line calculated from all 9 RAMA moving averages, and two more lines – the offset relative to the average line “up” and “down” by the calculated standard deviation (SD) for the 9 RAMA moving averages.
In addition, Figure 3 shows a signal line (yellow). The signal line is a RAMA(20) moving average with a smoothing period of 20 (the maximum period from the set of nine RAMA moving averages (Figure 2)).
From the analysis of Figures 1 and 3, in general, the rules for using the indicator follow:
- RASL band (red lines) below the signal line (yellow) – the movement of quotes on average (within the calculated RASL band) “down”,
- RASL band above the signal line (yellow) – the movement of quotes on average (within the calculated RASL band) “up”, plus reversal areas.
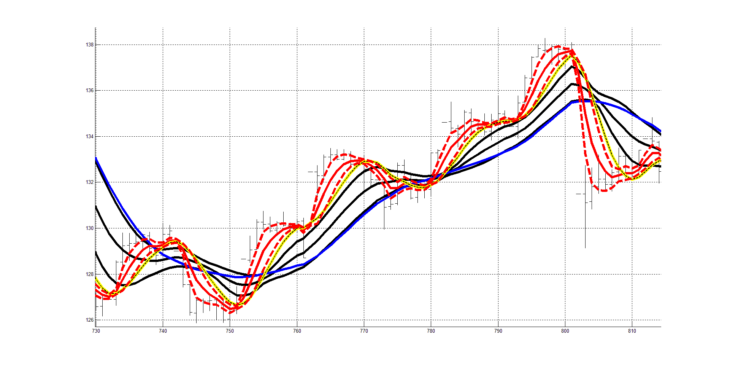
Figures 4-6 show the stages of building the technical RASL layer indicator calculated from a set of 9 RAMA moving averages with smoothing periods ranging from 20 to 60 with a step of 5 (20, 25, 30, 35, 40, 45, 50, 55, 60).
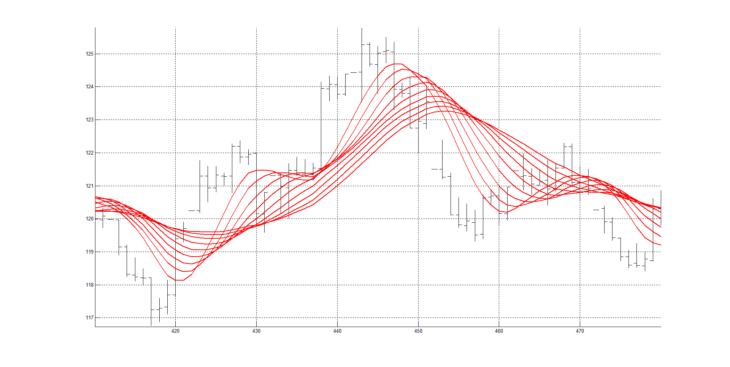
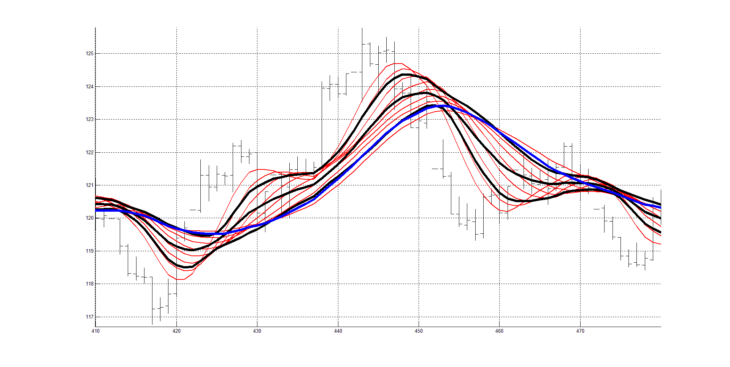
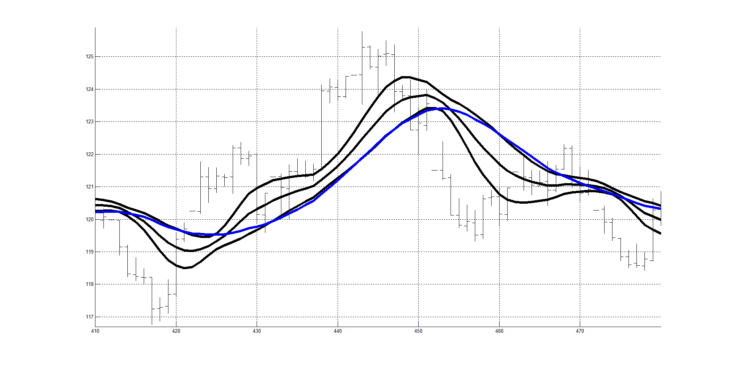 Fig. 6. Example of the RASL indicator for the layer
FAQ
What is the RASL layer indicator?
The RASL layer indicator is a technical tool that breaks down quote signals into simpler band components using multiple RAMA moving averages.
How is the RASL indicator calculated?
The RASL indicator calculates the average and standard deviation of RAMA values across different smoothing periods, forming upper and lower bands around a signal line.
What is the purpose of the RASL indicator in trading?
The RASL indicator helps identify trends and potential reversal areas by showing whether price movements are within an upward or downward band relative to a signal line.