


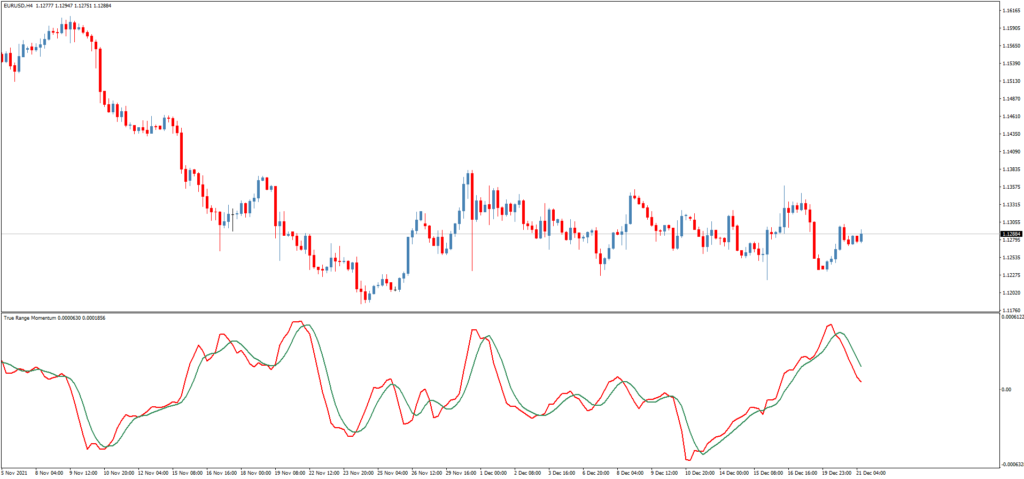
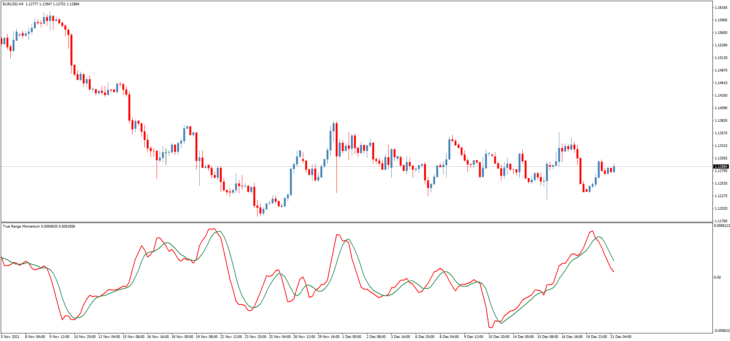
The True Range Momentum Volatility Trading Indicator is an attempt to improve the ATR indicator. True Range Momentum combines ATR with a double MACD. That is, a MACD is built based on ATR data. Then another MACD (red line) is built using that MACD data. In other words, we measure the acceleration of acceleration. Based on this data, a signal line (green line) is then created.
Parameters of the True Range Momentum Indicator
- ATR depth – typically ATR considers the current and previous bar. This parameter specifies which bar to use instead of the previous one. (if 1, it’s the classic ATR)
- Period ATR – ATR period
- Period second MA – period used to build the MACD.
- Period signal – signal line period.
- Moving average type – type of moving average for MACD
- Signal moving average type – type of moving average for the signal line.
Interpreting the True Range Momentum Volatility Trading Indicator is straightforward:
- The red line above the green line indicates increasing volatility;
- If the opposite is true, volatility is decreasing, and there is a higher chance that the previous trend is ending.
Download the True Range Momentum Volatility Indicator
Other Profitable Trading Indicators
FAQ
What is the True Range Momentum Indicator?
The True Range Momentum Indicator combines ATR with a double MACD to measure volatility changes in trading.
How does the True Range Momentum work?
It uses ATR data to create a MACD, then another MACD from that data to measure the acceleration of volatility.
What are the benefits of using this indicator?
This indicator helps traders identify when volatility is increasing or decreasing, signaling potential trend changes.


