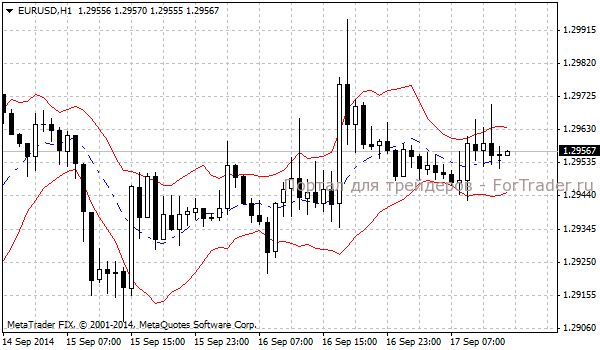
The Forex indicator Keltner Channel displays the Keltner Channel on a price chart, based on price volatility. The channel, similar to Bollinger Bands, consists of three lines:
- The middle line is a simple moving average with a period of 10, calculated using ‘typical’ prices ((high + low + close) / 3);
- The upper and lower lines are derived by adding and subtracting the average daily price range from the middle line.
Parameters of the Keltner Channel Indicator
- MA_Period (default = 10) — the period of the moving average (middle line).
- Mode_MA (default = MODE_SMA) — the type of moving average (middle line).
- Price_Type (default = PRICE_TYPICAL) — the type of price used for the moving average (middle line).
Trading Application
The Keltner Channel indicator uses a classic approach — buying when a candle closes above the upper channel boundary and selling when a candle closes below the lower channel boundary.
Exit trades can be managed using a conservative stop-loss or when the price crosses the middle line of the channel.
Experts at ForTraders.org recommend using additional indicators to confirm signals, as standalone use of the Forex indicator Keltner Channel can produce false signals.
Download the Forex indicator Keltner Channel
You may also be interested in


FAQ
What is the Keltner Channel used for?
The Keltner Channel is used to identify potential trading opportunities by showing price volatility through a channel structure.
How does the Keltner Channel work?
The Keltner Channel works by plotting a middle line (moving average) and two outer lines (based on average daily price range), helping traders spot overbought or oversold conditions.
Can the Keltner Channel be used alone?
While the Keltner Channel can be used alone, it’s often recommended to combine it with other indicators to reduce the risk of false signals.