


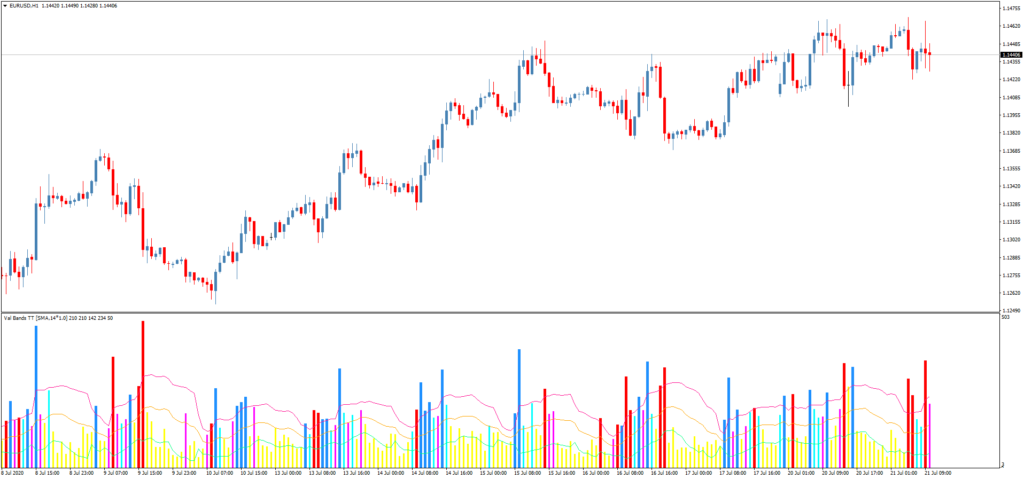
The Val Bands v3 TT trading indicator is a volatility indicator that measures candlestick length:
- Yellow histogram: candlestick length in pips;
- Lines: average/signal lines based on candlestick length with standard deviation.

The Val Bands v3 TT indicator is useful for tracking market gaps. Anything above the red line is considered a gap.
Break above the upper boundary:
- Take profit (if in a position);
- Stop loss (if against a position);
- Prohibition of entering at this point.
Break below the lower boundary:
- Range (flat market).
Crossing the lower boundary from below:
- Start of a trend.
Candle colors of the indicator:
- Buy candle above the upper level: blue color, width 3;
- Sell candle above the upper level: red color, width 3;
- Buy candle above the central level but below the upper level: light blue color, width 2;
- Sell candle above the central level but below the upper level: purple color, width 2;
- Other candles in yellow color.
Download Val Bands v3 TT Trading Indicator
Discuss Val Bands v3 TT Indicator with the Author and Traders
Other Profitable Trading Indicators
- MFI+RSI Divergence TT Trading Indicator
- Hull Master 22 Next MTF Trend Trading Indicator
- CCI’HMA MinMax Levels AA MTF SV+TT Signal Trading Indicator
FAQ
What is the Val Bands v3 TT indicator?
The Val Bands v3 TT is a volatility indicator that measures candlestick length to help traders identify market gaps and trends.
How does the Val Bands v3 TT work?
The indicator uses a yellow histogram to show candlestick length in pips and lines based on average/signal values with standard deviation to track market movements.
What are the benefits of using Val Bands v3 TT?
It helps traders identify potential entry and exit points, manage risk through stop-loss and take-profit levels, and detect market trends or ranges effectively.


