


The KG Support and Resistance Trading Indicator displays support and resistance levels on price charts, calculated using classical symmetric fractals.
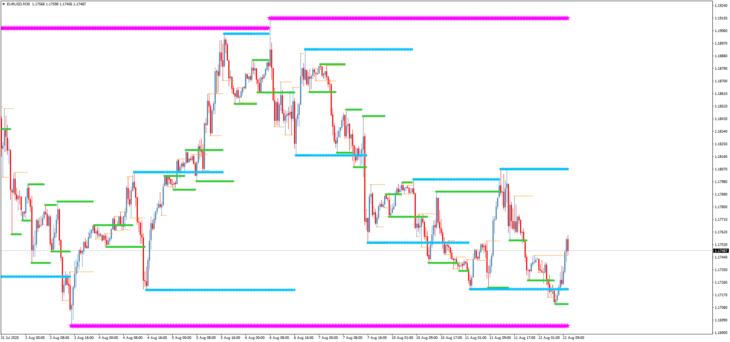
The KG Support and Resistance indicator displays levels from four timeframes, which can be set in the settings.
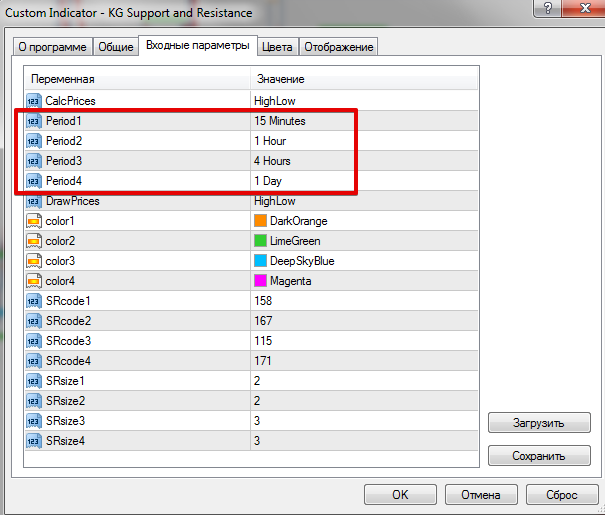
The indicator uses two types of calculation (CalcPrices):
- based on High/Low prices;
- based on Open/Close prices.
and two types of drawing (DrawPrices):
- based on High/Low prices;
- based on Open/Close prices.
The KG Support and Resistance Trading Indicator is an effective tool for breakout and bounce strategies.
- Download the KG Support and Resistance Indicator
Other Profitable Trading Indicators
- Trading Indicator Overbought Oversold Level without Redrawing
- Arrow Trading Indicator CCI Channel TT
- Trading Indicator Val Bands v3 TT
FAQ
What is the KG Support and Resistance Indicator?
The KG Support and Resistance Indicator is a tool that identifies key support and resistance levels on price charts using fractal patterns.
How does the KG Support and Resistance Indicator work?
The indicator calculates support and resistance levels based on High/Low or Open/Close prices and displays them on the chart for various timeframes.
Why is the KG Support and Resistance Indicator useful for traders?
It helps traders make informed decisions by highlighting key levels where price may reverse or break through, supporting breakout and bounce trading strategies.


