The Palo4nik Level Trading Indicator is designed to visualize support and resistance levels. It also allows users to manually draw a ZigZag and quickly change the color of graphical objects.
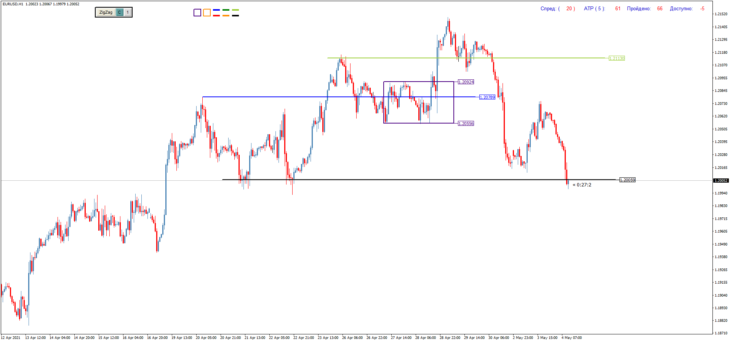
Graphical objects are managed using the mouse and keyboard shortcuts:
- [Q] – Show keyboard shortcut hints
- [W] – Hide / show price labels for levels
- [E] – Hide / show object descriptions
- [Z] – Enable / disable continuous ZigZag drawing
- [Esc] – Stop continuous ZigZag drawing
- [A] – Set ZigZag color to red
- [D] – Set ZigZag color to blue
- [Ё] – Move ZigZag drawing buttons
- [X] – Hide / show ZigZags from higher timeframes
- [Ctrl] + [Left Click] – Add / remove any object
- [Shift] + [Left Click] – Quick color, thickness, or fill panel for shapes
- [Tab] + [Left Click] – Extend lines to the end of the chart (period separator)
- [CapsLock] + [Left Click] – Truncate lines and rectangles
- [S] – Hide / show levels on all timeframes
Video Instructions for Using the Palo4nik Indicator
- Download the Palo4nik Trading Indicator
Other Profitable Indicators for Trading
- CHAMPION Forex Holy Grail Arrow Indicator Without Redrawing
- Trend Direction and Force Trend Indicator
- Advanced Supply Demand Trading Indicator
FAQ
What is the Palo4nik Level Trading Indicator?
The Palo4nik Level Trading Indicator is a tool that visualizes support and resistance levels and allows manual drawing of a ZigZag.
How do I use the Palo4nik indicator?
You can use the Palo4nik indicator by managing graphical objects with your mouse and keyboard shortcuts like [Q], [W], [E], and others.
Where can I download the Palo4nik indicator?
You can download the Palo4nik indicator from the provided link in the article.