


In our previous discussion on the peculiarities of applying technical analysis to Russian stocks, we talked about the magic of triangle patterns on daily charts. In this article, I will explain what happens if a triangle starts forming from the ‘apex’ rather than the ‘base,’ resulting in an expanding formation pattern. As usual, I won’t repeat textbook wisdom; instead, we’ll compare theory with reality right away.
The Expanding Formation Pattern Is Not for Speculation!
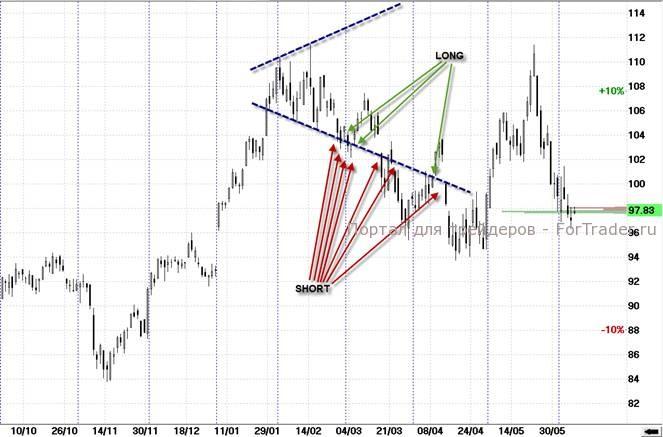
No need to look far for an example of the expanding formation pattern. It is present on the daily chart of the most popular stock, Sberbank, from the beginning of 2013.
A common mistake among traders is attempting to trade based on this pattern. In my opinion, the ‘Expanding Formation’ can only serve as:
- a warning of increased volatility;
- an explanation of temporary issues in one’s trading strategy.
The figure on Sberbank vividly demonstrates the standard but relatively calm behavior of various stocks. Let’s calculate what financial result we would have achieved if we had traded speculatively within the formation.
With a minimal time filter determining the breakout of any given figure, a speculator could make up to 10 trades within the ‘Expanding Formation’ pattern until a full downward trend emerged. Only 4 trades were sufficiently profitable and could have yielded between 3% to 6.5% profit, provided the trader did not get greedy and did not wait for the stock to reach the opposite boundary of the formation. The remaining trades barely covered trading costs.
You might say that the overall trading result with reinvestment could have been quite good. However, note that one awkward move could have completely negated it. Additional risk may also arise from the frequency of signals—10 signals over 45 days, which is no joke for a beginner! Especially if he trades with his own money rather than practicing on a demo version of the trading terminal.
Development of the Expanding Formation Pattern
Speculating on what could have happened is endless; it’s much more interesting to observe the pattern as it develops. As homework, I assign you to observe the current ‘Expanding Formation’ pattern on the daily chart of Rosneft.
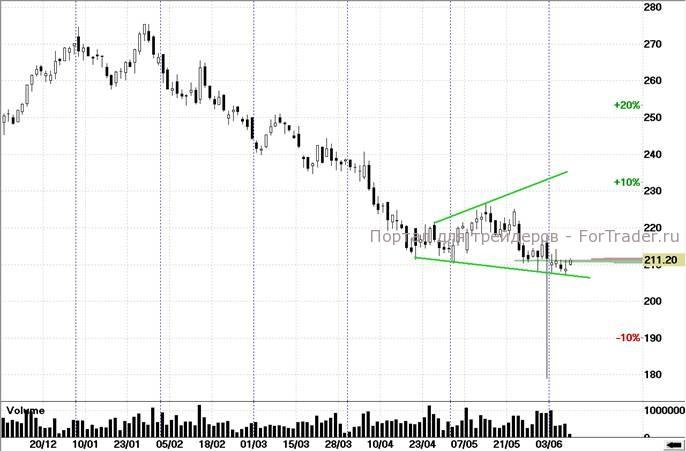
Here, the pattern has already shown its teeth (see the candle from May 31, 2013). Of course, this candle was not formed due to the action of the ‘formation,’ but within its framework, it does not seem particularly unexpected or unrealistic. This also happens! This chart serves as a reminder that within the ‘Expanding Formation’ pattern, relaxation is not an option!
So now you have something to do. Meanwhile, I will prepare a new article for you, where we will find out what happens to the quotes of domestic stocks if the ‘Expanding Formation’ pattern merges with the ‘Symmetrical Triangle’ figure and forms the ‘Diamond (Rhombus)’ figure.
Other Articles on Technical Analysis Patterns
- More on Technical Analysis Patterns: ‘Triangle’ or ‘Head and Shoulders’?
- Technical Analysis Patterns: ‘Triangles – Symmetrical and Expanding’
- ‘Flags’ and ‘Pennants’: Characteristics of Pattern Analysis
- Trend Reversal Pattern ‘Diamond or Rhombus’: A Dangerous Signal for Traders
FAQ
What is the Expanding Formation pattern?
The Expanding Formation is a technical analysis pattern that indicates increased volatility and potential issues in trading strategies.
Is the Expanding Formation suitable for speculation?
No, the Expanding Formation is not recommended for speculative trading due to its unpredictable nature and high risk.
How can traders use the Expanding Formation?
Traders should treat the Expanding Formation as a warning signal for increased volatility and adjust their strategies accordingly.


