


This article presents an indicator-based trading strategy that the author considers generally stable, offering moderate profitability over a short period. The strategy uses standard indicators: ATR (11) with a MA (21) overlay, and ADX (14). For better visualization, the Swing zzz indicator is also used, although it is not applied in actual trading. You can download the indicator at the end of the article.
Trading Time
The strategy is applied during active daily hours: from 8:00 GMT +0 at the opening of London to 21:00 GMT +0 at the closing of New York.
Trading Strategy Rules
Buy Signal
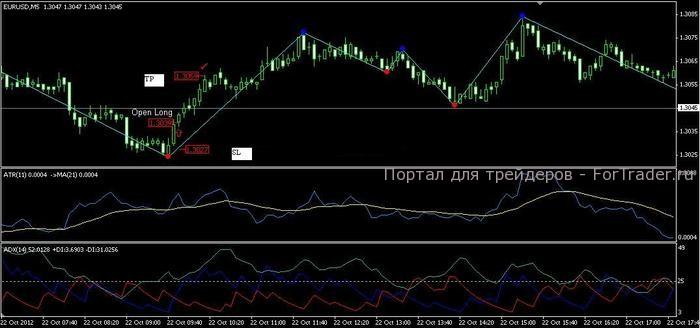
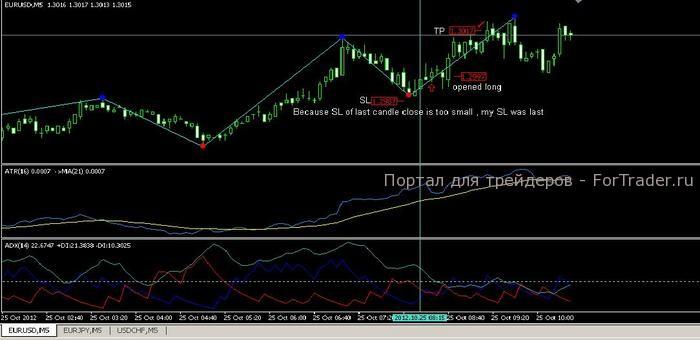
A buy signal appears when the following conditions are met:
- The ADX indicator is above the 25 level;
- The ATR indicator is above the MA;
- +DI crosses -DI.
Buy Signal
Stop-Loss
Set the stop-loss at the minimum of the last candle plus 2 pips. If the resulting stop is less than 10 pips, increase it to 15 pips.
Take-Profit
Set the take-profit at 20 pips. You can also try using a trailing stop.
Sell Signal
A sell signal appears when the following conditions are met:
- The ADX indicator is above the 25 level;
- The ATR indicator is below the MA;
- -DI crosses +DI.
Sell Signal
Download the strategy indicators
FAQ
What is the ATR indicator?
The ATR (Average True Range) measures market volatility by calculating the average range of price movements over a specific period.
How does the ADX indicator work?
The ADX (Average Directional Index) measures the strength of a trend. It helps traders determine if a market is trending or ranging.
What are the key conditions for a buy signal?
A buy signal occurs when the ADX is above 25, the ATR is above the MA, and +DI crosses -DI.


