The trading strategy discussed below uses combinations of Price Action patterns – ID/NR4 and IB to identify market entry signals.


Input Parameters
- Currency pairs: any.
- Timeframe: H4 and higher.
- Trading time: any.
- Risk management: after calculating the stop-loss, choose a lot size so that the risk is no more than 2-5% of the deposit per trade.
Used Indicators
- HVR (Historical Volatility Ratio) – an unconventional volatility indicator that serves as a filter;
- VM price action – an indicator for identifying ID/NR4 and IB price patterns.
- Moving Average – a moving average with a period of 3, which serves as a trend filter.
Used Price Action Patterns
- Pattern ID/NR4 (inside day/narrowest daily range of the last four days – inside day/minimum daily range over the last four days)
ID/NR4 is a classic day breakout pattern. It involves opening a position with a good profit-to-risk ratio at the moment of market range contraction.
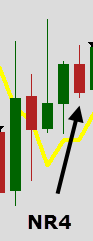 ID/NR4 Pattern
- Pattern IB (Inside bar – inside bar)
The IB pattern is a bar whose range does not exceed the range of the previous bar. In other words, it is a bar where the high is lower than the high of the previous bar, and the low is higher than the low of the previous bar.
 IB Pattern
Note: it should be noted that the minimum or maximum price (but not both) of the inside bar can be equal to the minimum or maximum price of the previous candle.
- Combined pattern consisting of NR4 and IB patterns
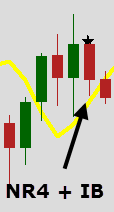 Combined pattern consisting of NR4 and IB patterns
Setting Up Indicators and Strategy Template
- Unzip the template and indicator archive.
- Copy the indicators to the MQL4 -> indicators folder.
- Copy the template to the templates folder.
- Restart the terminal.
- Open the chart of the desired currency pair.
- Apply the template named nr4-ib.
The chart should look like this:
 Trading Strategy Template Based on ID/NR4 and IB Patterns
Signals Indicating Long Position (Buy) Entry
- A combined NR4 + IB pattern appears on the chart.
- The price is above the yellow moving average.
- Optional condition: the HVR indicator (lower window) is below the level of 1.
- Place a Buy Stop pending order one point above the high of the previous bar.
- Stop-Loss is set 10 points below the previous bar.
- Take-Profit is 20-30 points (if trading on H4) or 40-60 points (if trading on D1).
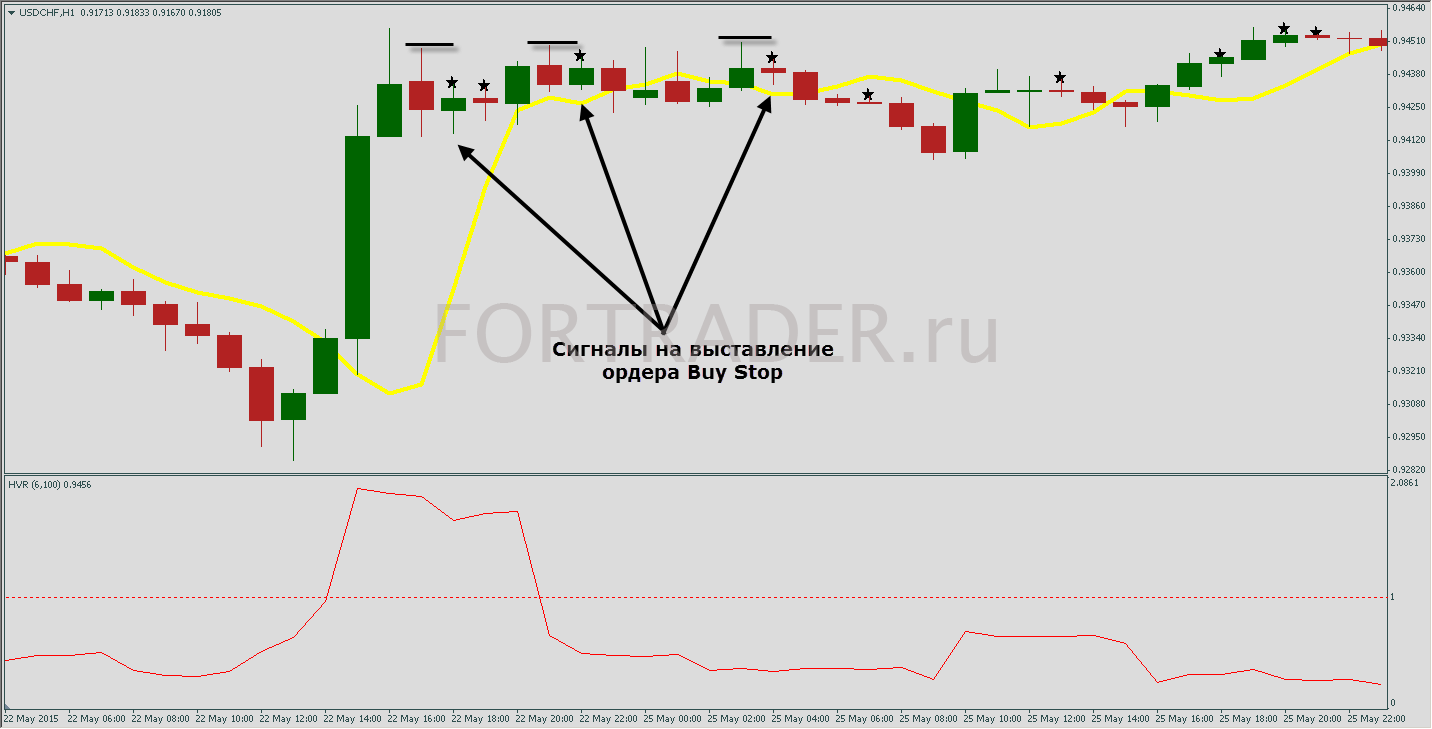 Examples of long trades
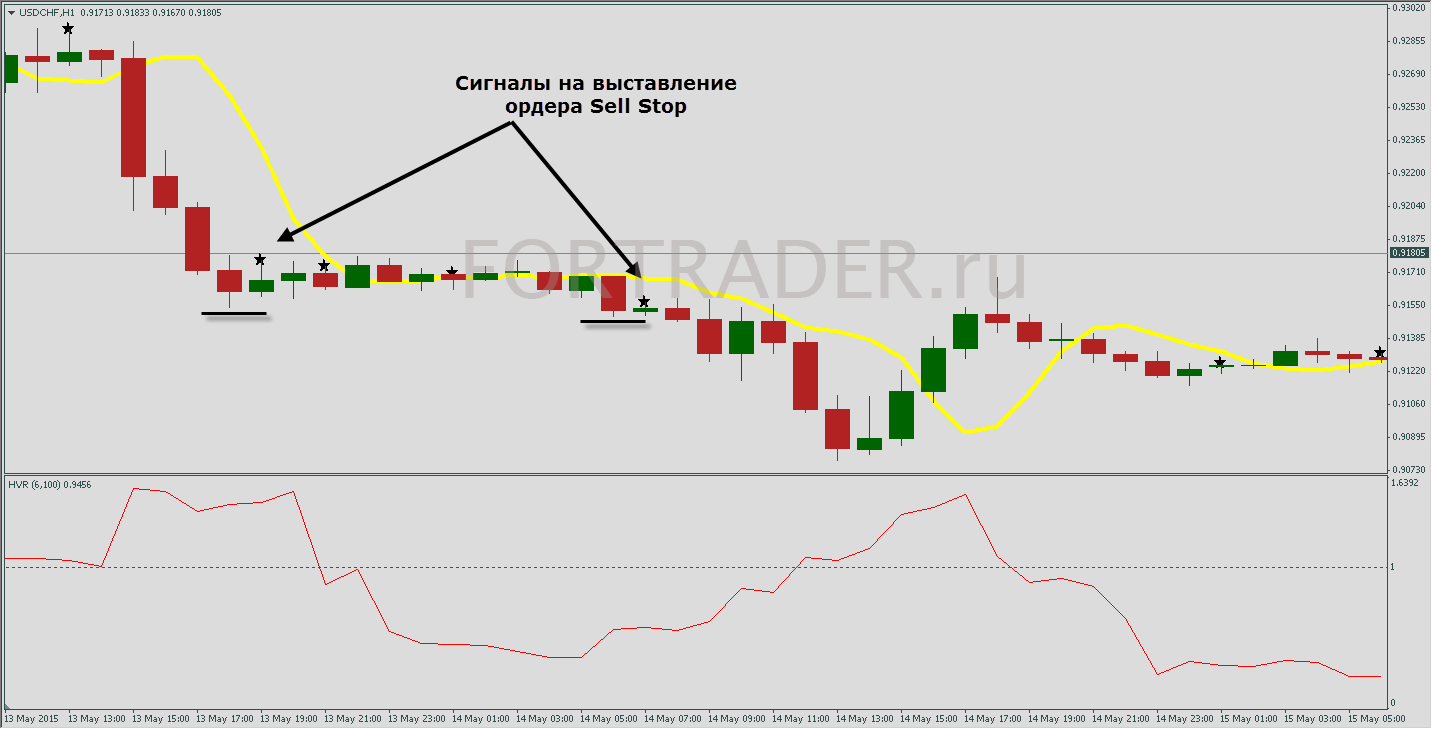
Signals Indicating Short Position (Sell) Entry
- A combined NR4 + IB pattern appears on the chart.
- The price is below the yellow moving average.
- Optional condition: the HVR indicator is below the level of 1.
- Place a Sell Stop pending order one point below the low of the previous bar.
- Stop-Loss is set 10 points above the previous bar.
- Take-Profit is 20-30 points or 40-60 points.
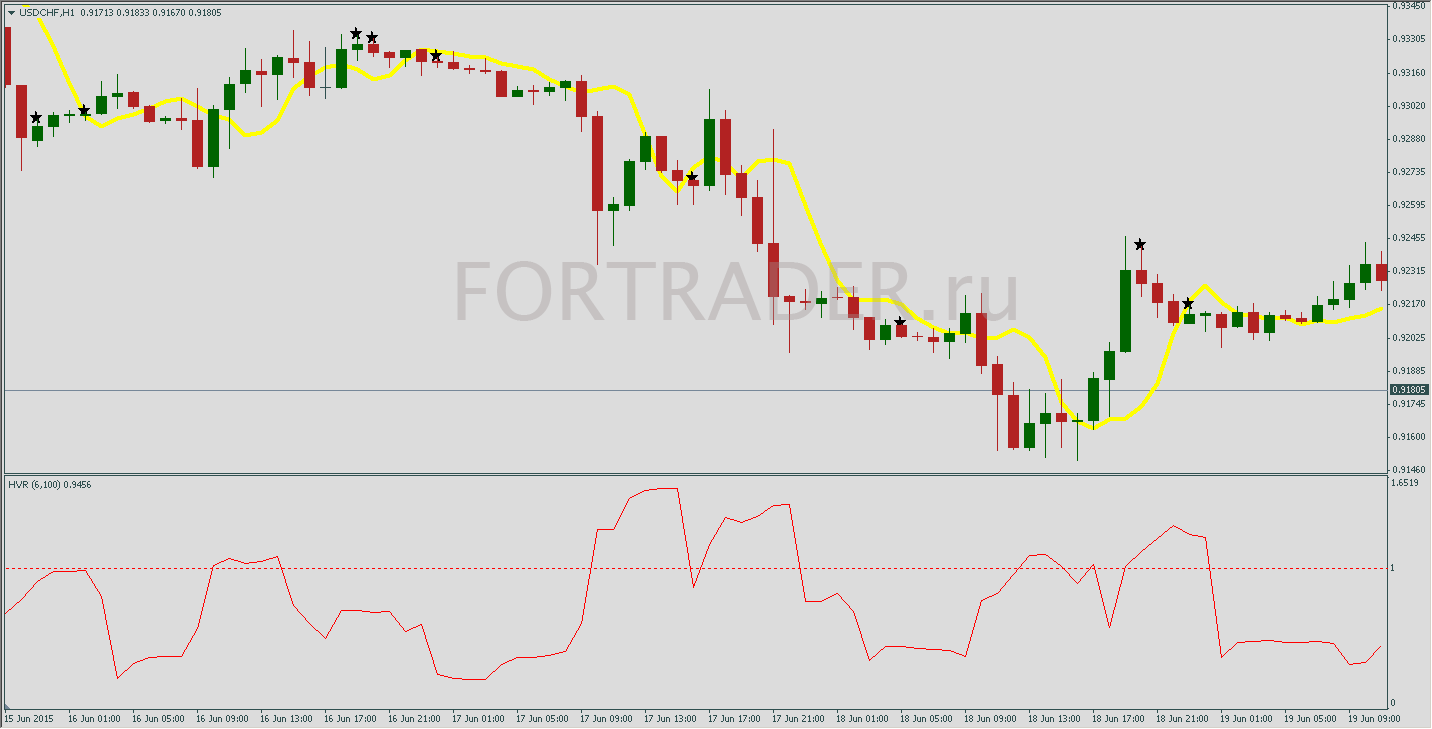
 Examples of short trades
Using price patterns, especially Price Action patterns, in trading strategies is very popular among traders because it is based on using technical analysis patterns rather than signals from technical indicators, which can be interpreted completely differently.
It should be noted that the strategy uses pending orders, which, according to experts from ForTraders.org, significantly reduces trading risks and frees the trader from having to be constantly at the terminal.
The trading strategy based on ID/NR4 and IB patterns involves trading on H4 and higher timeframes, which significantly reduces the psychological pressure on the trader.
<a href=”http
FAQ
What are the key price action patterns used in this strategy?
The strategy uses ID/NR4 and IB patterns for identifying market entry signals.
What timeframes is the strategy suitable for?
The strategy is designed for H4 and higher timeframes.
How are stop-loss and take-profit levels determined?
Stop-loss is set 10 points away from the previous bar, and take-profit varies between 20-60 points depending on the timeframe.


