The portfolio spread strategy trades eight assets across equities, currencies, and commodities on a single chart, delivering 116% returns over four years with just 11% maximum drawdown. This market-neutral approach captures global capital flows by going long equities and short commodities during economic recovery.
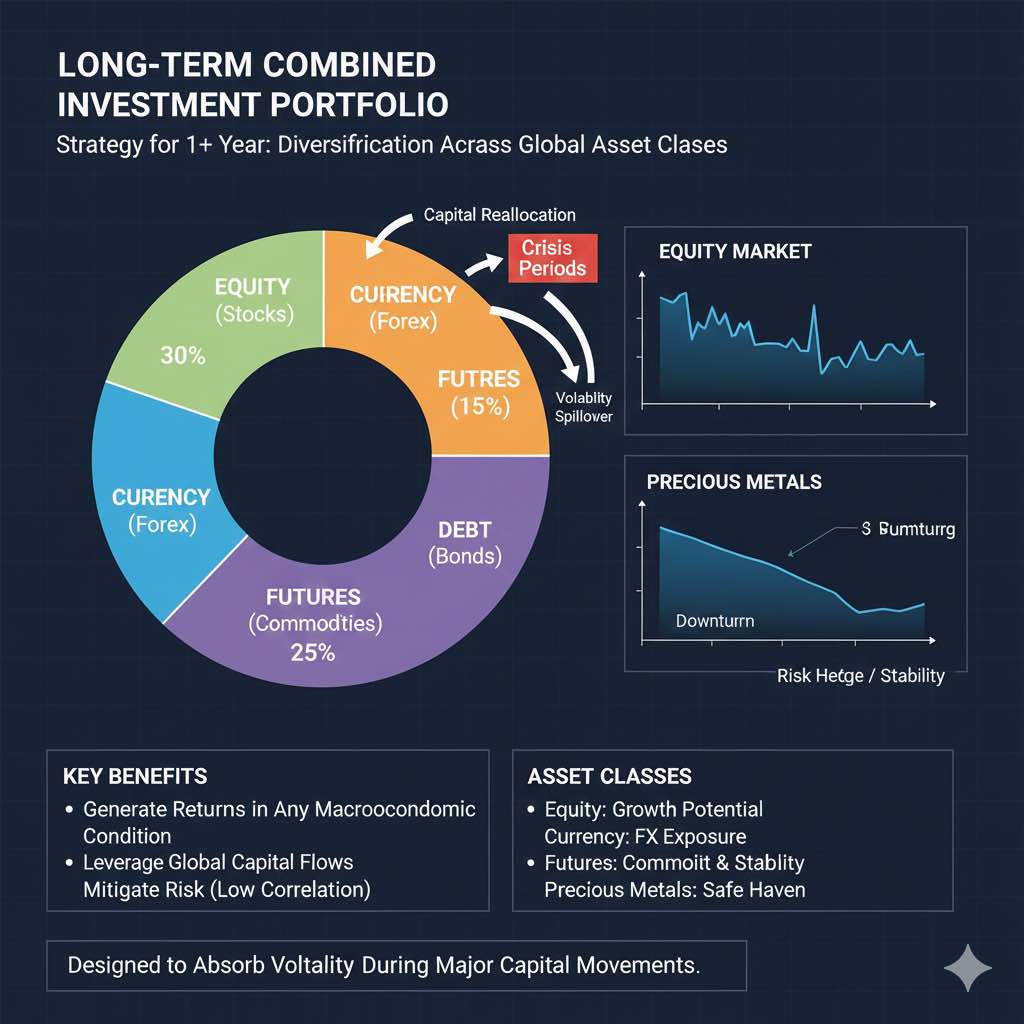
Mixed portfolios combine assets from equity, currency, futures, debt, and other segments. During crises, capital shifts from equities to precious metals for hedging. A combined portfolio leverages these flows across liquid markets under any macroeconomic conditions.
Portfolio Spread Composition
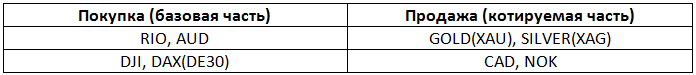
The “Two Trends” (DT) position quotes a currency-equity portfolio (VF) = (RIO + AUD + DJI + DE30) against commodity instruments: gold, silver, and petro-currencies CAD + NOK.
- Rio Tinto Group shares (RIO) on London Stock Exchange
- Dow Jones Industrial Average (DJI)
- German DAX index (DE30)
- Australian dollar (AUD)
Buying DT means buying VF and selling the commodity portfolio (CP) = (XAU + XAG) + (CAD + NOK). CAD and NOK correlate 91% and 96% with Brent crude oil. The spread includes:
- DJI + DE30 vs. CAD + NOK
- RIO + AUD vs. XAU + XAG
Returns depend on the spread between long equity and short commodity positions, providing market neutrality and stability during volatility.
Portfolio Weighting and Setup
Optimized using weekly closes from August 15, 2011, to April 27, 2015, via NetTradeX and GeWorko model. Weights follow CAPM: base VF – RIO(5%), AUD(24%), DE30(25%), DJI(46%); quoted CP – CAD(26%), NOK(12%), XAG(23%), XAU(39%). Volumes equalize like cross-rates.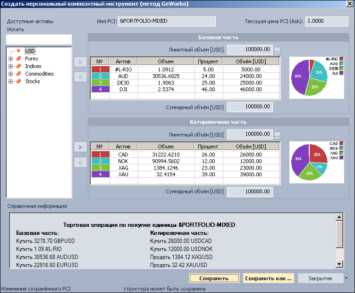 GeWorko Interface. NetTradeX Platform
Historical Performance: 116% Return
From January 30, 2012, to December 10, 2013, returns were flat with 11% drawdown amid QE tapering and stagnation.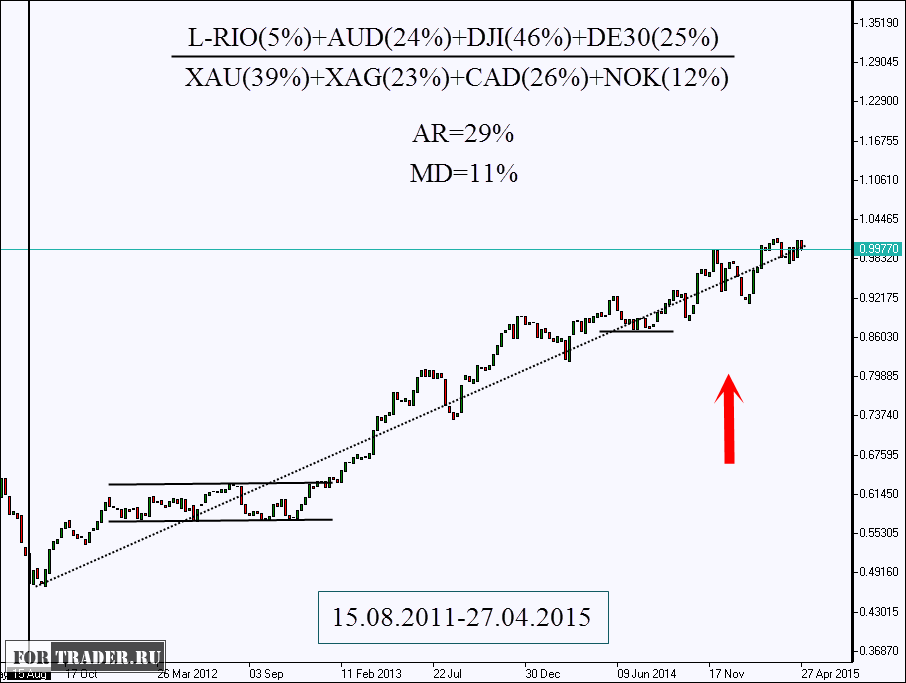 Value of the “Two Trends” portfolio. NetTradeX Platform.
Global GDP fell from 10.7% to 2.7%; US shale oil rose from 5.18 to 7.44 million barrels/day. Overall period yielded 116% return, or 10.5% annualized.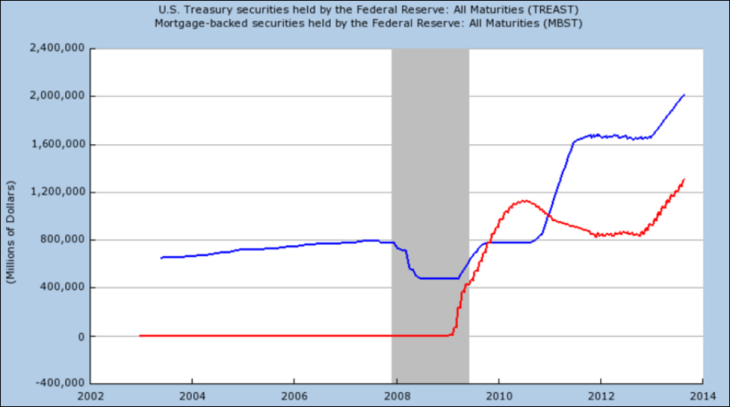 Volume of bonds in Fed funds 2004-2014
Fundamental Drivers
Oil Supply Surge
US shale costs dropped $30/barrel; OPEC held quotas in 2014, pressuring petro-currencies (CAD -12%, NOK -17%) while boosting stocks.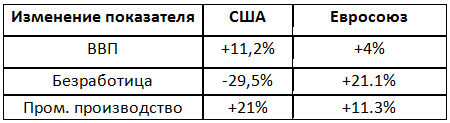 Changes in macroeconomic indicators 2009-2014
Precious Metals Decline
Gold fell 24% from February 25, 2013; AUD -25%, RIO -18% as risk appetite returned.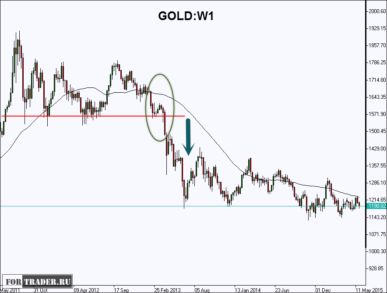
Risks
US debt-to-GDP at 122.7%, rising faster than GDP/income; 2015 rate hikes could slow growth.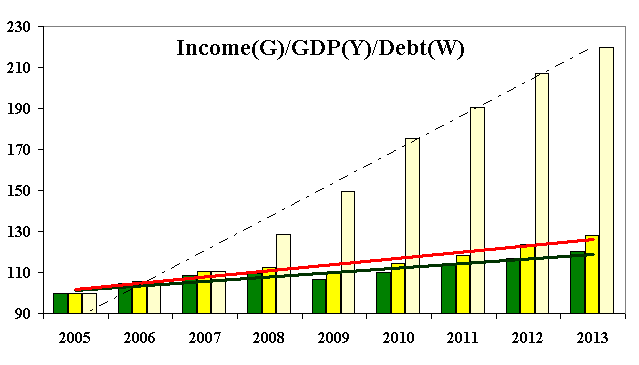 US economic indicators. Per capita income (green),
GDP (yellow) and government debt (white)
Trading and Management Strategy
Open positions in NetTradeX by specifying equal volumes.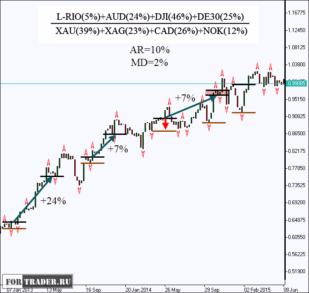 Trend-following strategy. NetTradeX Platform.
- Passive: Hold 1-2 years or until fundamentals shift
- Active rebalancing via CAPM or outlook changes
- Trend-following: Buy on Bill Williams fractal break, stop at fractal low (10% annual return, 2% risk)
FAQ
What is a portfolio spread?
A market-neutral strategy quoting one asset basket against another, like equities vs. commodities, traded as a single instrument on one chart.
How do you weight the assets?
Use CAPM model: VF basket RIO(5%), AUD(24%), DE30(25%), DJI(46%); CP basket CAD(26%), NOK(12%), XAG(23%), XAU(39%). Equalize volumes.
What returns did it achieve?
116% total return from 2011-2015 (10.5% annualized) with 11% max drawdown; active trend-following yielded 10% yearly at 2% risk.