


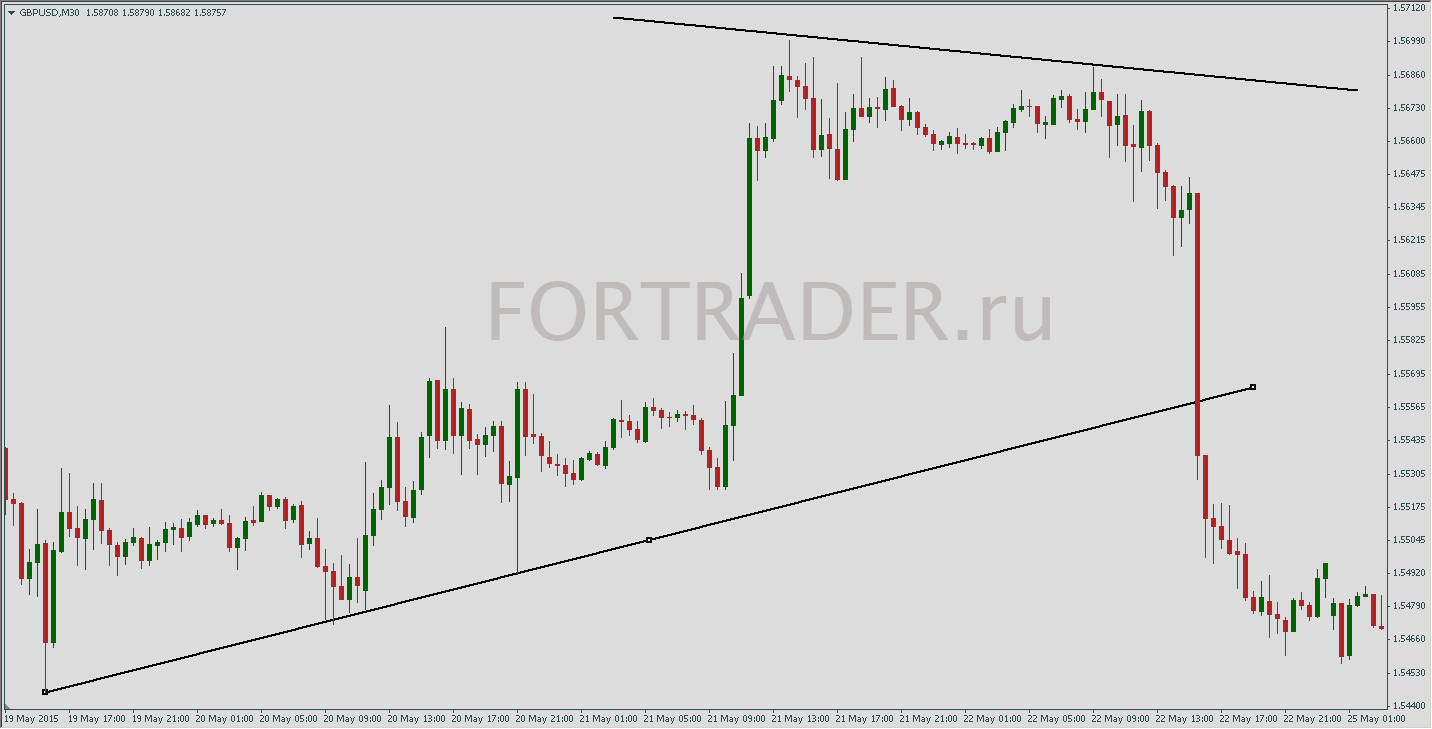
The Trading System Based on the Technical Analysis Pattern ‘Cone’ can be used for both position and intraday trading, depending on your preferred time frame. The strategy uses variations of the price pattern ‘Cone’: Rising Cone, Falling Cone, and candlestick reversal formations.
Input Parameters
- Currency Pairs: Any.
- Time Frame: Any.
- Trading Time: Any.
- Risk Management: After calculating the stop-loss, choose a lot size so that the risk is no more than 2-5% of the deposit per trade.
Price Chart Setup
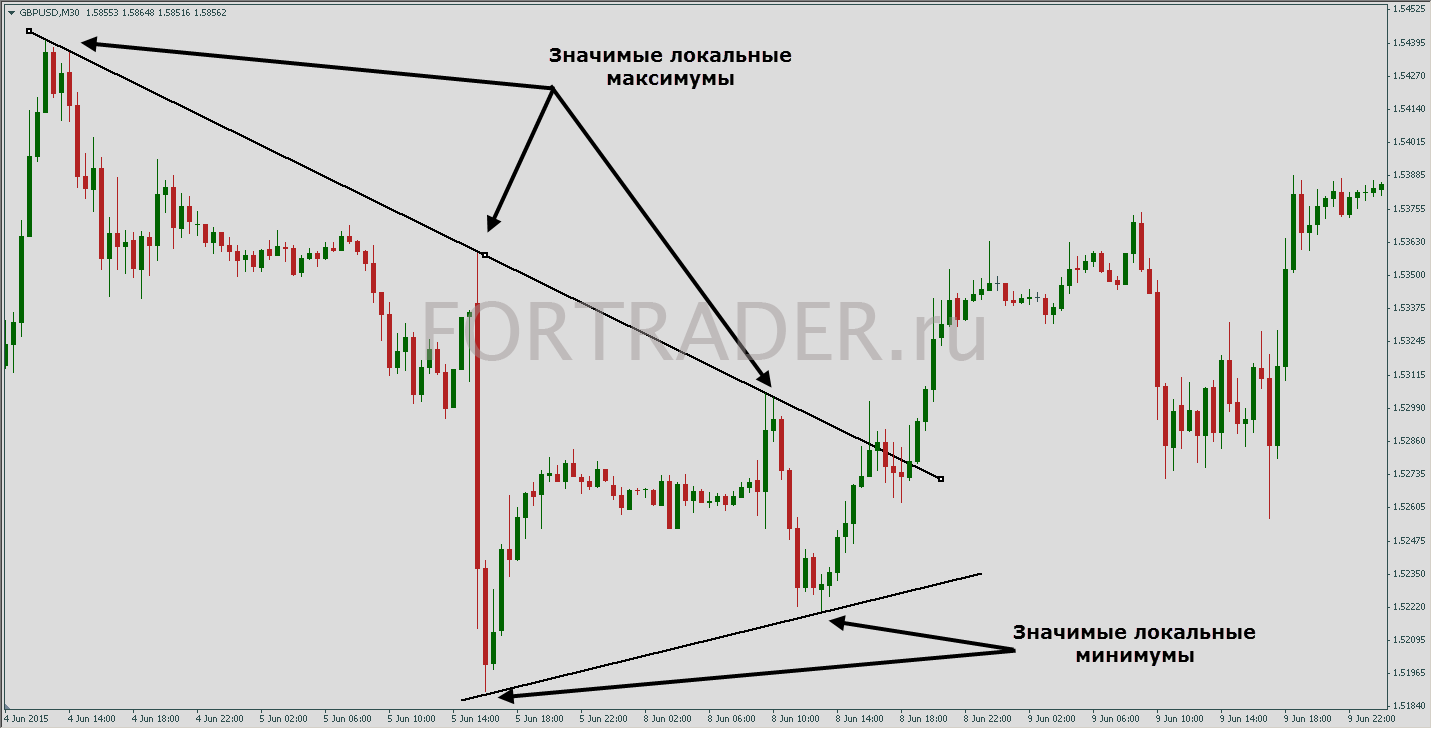
For trading using the technical analysis pattern ‘Cone’, no special template is required since it is a non-indicator strategy. First, mark important support/resistance levels, then start looking for the ‘Rising’ and ‘Falling’ cone patterns of technical analysis.
What Does the Technical Analysis Pattern ‘Cone’ Look Like
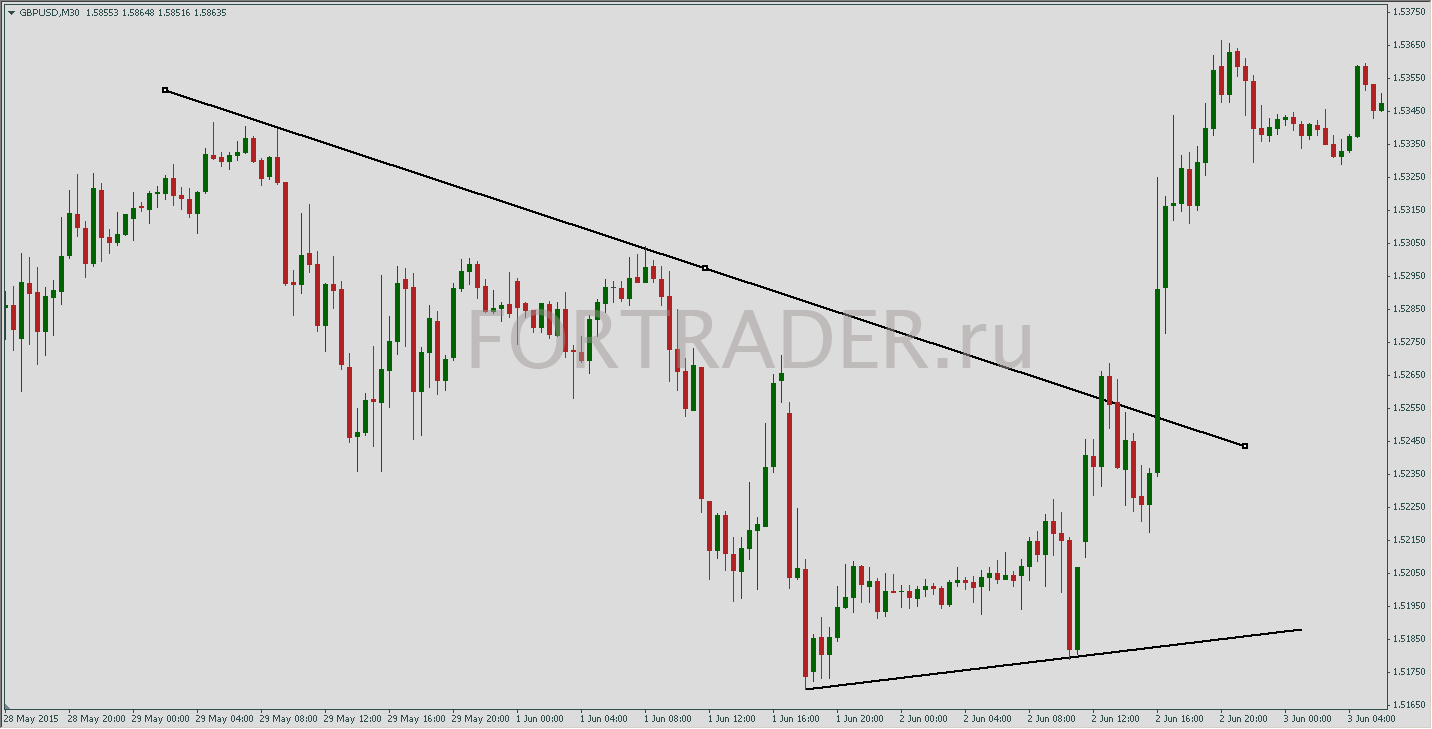
The technical analysis pattern ‘Cone’ is somewhat similar to the Triangle pattern in that it appears when the price chart narrows and the trend lines converge. The ‘Cone’ pattern can indicate either a continuation or a reversal of the market and has a noticeable downward or upward slope. There are several methods for identifying these technical analysis patterns, one of which is shown below.
Using the Technical Analysis Pattern ‘Cone’ in the Trading Strategy
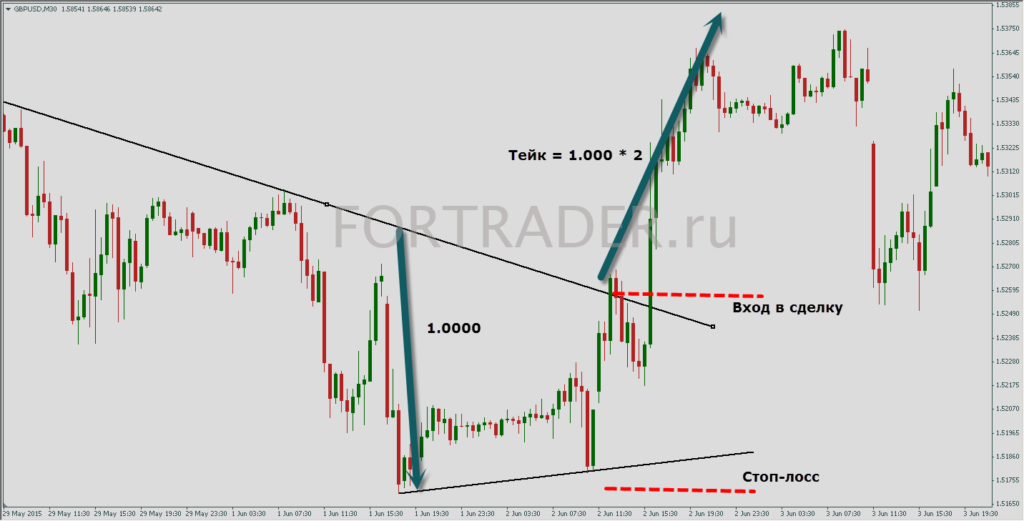
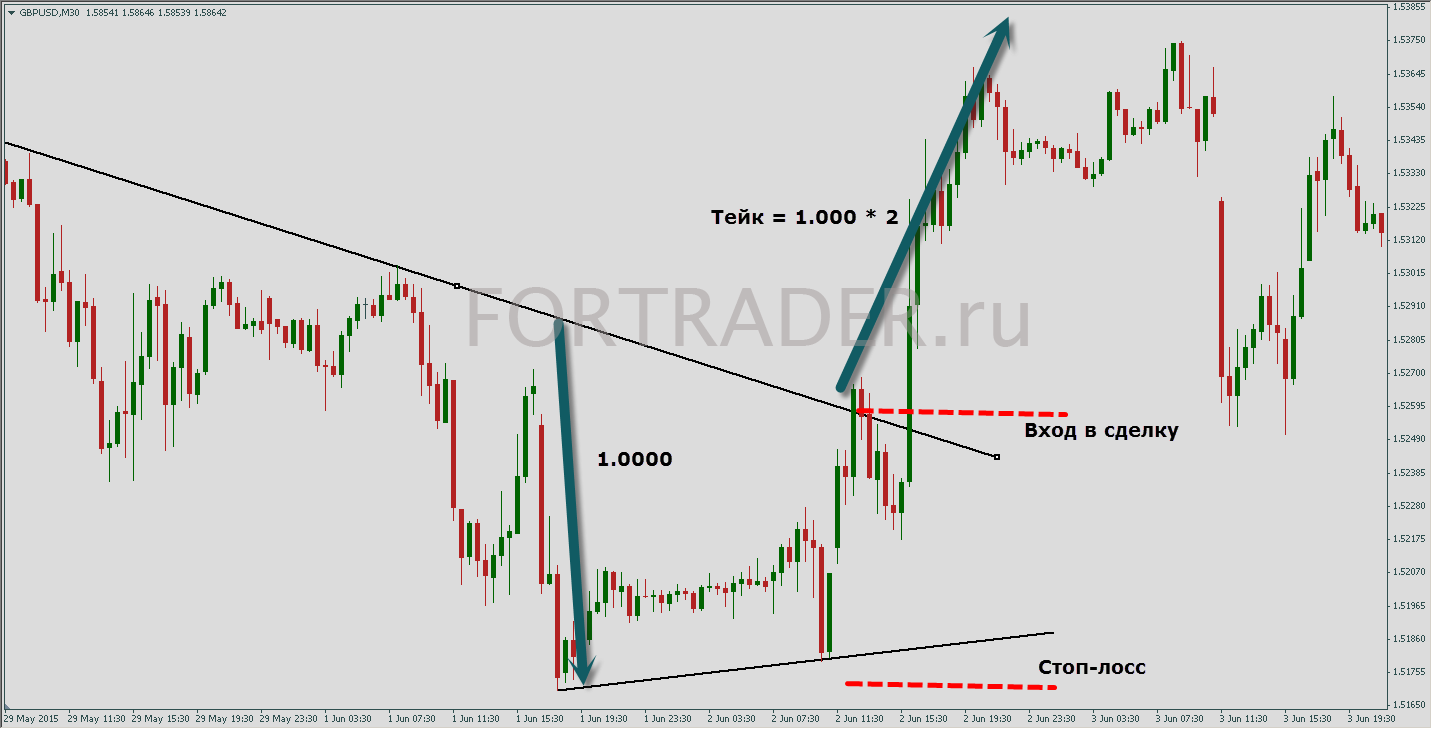
The principles of trading will be discussed using the example of the ‘Falling Cone’ pattern, when a long position is opened.
Market entry can be done in two ways:
- Aggressive Method
The aggressive method involves entering the market at the breakout of the upper boundary of the ‘Cone’ pattern. You must have sufficient capital to withstand a potential pullback. The advantage of this approach is that if the price moves immediately in the desired direction without a pullback after the breakout, you won’t miss the opportunity to enter the trade.
- Conservative Method
The conservative method involves entering the market on a pullback after the breakout. However, in this case, you might miss the trade if the market has high volatility and the price moves without pullbacks.
A confirming signal for entering a trade can be a candlestick reversal combination.
- Place the stop-loss 15-20 points below the lower boundary of the cone.
- The take-profit size is twice the distance between the boundaries of the cone.
- You can exit the trade when a candlestick reversal combination appears, if the price has not yet reached the take-profit level.
According to experts from ForTraders.org, the technical analysis pattern ‘Cone’ appears quite frequently on currency pair price charts. Since the trading strategy is non-indicator based and relies solely on technical analysis rules, its effectiveness is somewhat higher than strategies based on indicators.
The Trading Strategy Based on the Technical Analysis Pattern ‘Cone’ has an additional advantage. This is because identifying the ‘Cone’ pattern is less challenging than determining, for example, the Head and Shoulders pattern or harmonic Gartley patterns.
More About Technical Analysis Patterns and Price Patterns
Other Trading Strategies Based on Price Patterns


 <a title=”4-Hour MACD FOREX Strategy: Pattern A” href=”https://fortraders.org/fortrader_archive/16-fortrader-
FAQ
What is the ‘Cone’ technical analysis pattern?
The ‘Cone’ pattern is a price chart formation where trend lines converge, resembling a triangle. It can indicate a continuation or reversal of the market trend.
How can the ‘Cone’ pattern be used in trading?
The ‘Cone’ pattern can be used to enter long or short positions. Traders can use an aggressive method by entering at the breakout or a conservative method by waiting for a pullback after the breakout.
What are the risk management rules for this strategy?
Risk should not exceed 2-5% of the deposit per trade. A stop-loss is placed 15-20 points below the cone’s lower boundary, and take-profit is twice the distance between the cone’s boundaries.


