


Trend reversal patterns ‘Double Bottom’ and ‘Double Top’ appear quite often on price charts, on any time frame. In technical analysis, they are a strong indicator of a trend reversal. The ‘Double Bottom’ pattern forms during a downtrend, while the ‘Double Top’ pattern forms during an uptrend.
Formation of the Technical Analysis Pattern ‘Double Top’
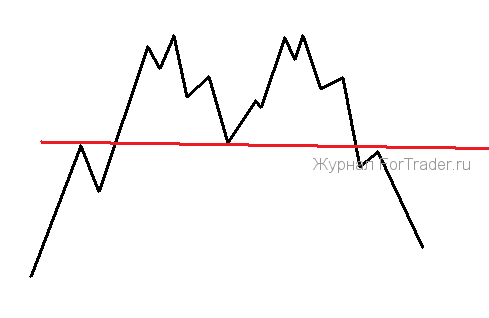
Let’s look at the image, which shows an example of the trend reversal pattern ‘Double Top’. Price breaks through a resistance level, reaches a certain maximum, then pulls back to the previous resistance level, which becomes the support for the ‘Double Top’ technical analysis pattern.

Price bounces off this support and makes a second attempt to rise, but fails to break the peak of the first top, and begins a more active decline. It quickly falls below the support level, often testing it from below, and starts to fall confidently.
Trading the Trend Reversal Pattern ‘Double Top’
It is better to enter the market after the failure of the second top and a bounce from the support level downward, as there may be a return to the peak to form the ‘Triple Top’ model.
A stop loss should be placed above the high of the double top, and the target should be measured from the support line to the high of the two tops.
The technical analysis pattern ‘Double Bottom’ is constructed in a mirror image with the same sequence of actions.

Other Articles on Technical Analysis Patterns
- Cup and Handle – a profitable continuation pattern of an uptrend
- Head and Shoulders: Features of Construction and Trading on Forex
- Flag and Pennant Patterns – Features of Continuation Trend Pattern Analysis
FAQ
What is a Double Top pattern?
A Double Top is a trend reversal pattern that occurs when the price reaches a resistance level twice and fails to break through, signaling a potential downtrend.
How do you trade a Double Top?
Traders typically enter a short position after the price breaks below the support level formed between the two peaks of the Double Top.
What is a Double Bottom pattern?
A Double Bottom is a trend reversal pattern that occurs when the price hits a support level twice and bounces back, indicating a potential uptrend.


