
A false breakout is one of the most frustrating situations for a Forex trader. Price breaks through an important support or resistance level, creates the illusion of a strong move, triggers placed orders, and then quickly returns to the range. As a result, the trader enters the market too late or not according to plan, and the trade almost immediately ends in a loss.
What Is a Breakout and How to Recognize a False One
A true breakout usually looks like a confident move beyond the level with continued momentum. For example, if a currency pair has struggled to rise above a resistance level for a long time, and then a strong candle breaks through and closes above it, traders may see this as a buy signal. In the case of a support breakout, the logic is the opposite: price moves below an important zone, and sellers get confirmation of market weakness.
Traders love trading breakouts because after breaking out of a range, price sometimes moves a large distance in a short time. At such moments, pending orders, stop-losses of participants who were against the movement, and new market orders trigger. All of this can amplify the momentum. Therefore, a breakout seems like a simple and clear signal: the level is broken, so it’s time to enter in the direction of the movement.
But the problem is that not every price move beyond a level is a real breakout. A false breakout occurs when price temporarily moves above resistance or below support, and then quickly returns back. On the chart, this can look like a sharp penetration of the level, a long candle wick, or a short move beyond the range without further continuation.
For example, price approaches a resistance level, breaks it upwards, triggers Buy Stop orders, and attracts buyers. But within a few candles, the market returns below the level. Those who entered on the breakout end up in a trap: the purchase is open, but the price moves down again. A false breakout of support happens in the same way, only in reverse: sellers enter after the price moves below the level, but the price quickly returns back up.
Why False Breakouts Occur
False breakouts often occur due to the accumulation of orders at obvious levels. Many traders place stop-losses just above resistance or just below support. There may also be pending orders for a breakout at these levels. When price reaches such a zone, many orders trigger, causing a sharp move, but if there’s no real demand or supply for continuation, the market quickly returns back.
Another reason is low liquidity. During periods when there are few active participants in the market, even relatively small orders can cause sharp price movements. This often happens during night hours, at the junction of trading sessions, or before important news. In such moments, a level may be pierced by a random impulse, but no full movement follows afterward.
News also plays an important role. During the release of data on inflation, interest rates, employment, or GDP, price can rapidly break multiple levels and then quickly return back. On news, spreads can widen, execution can worsen, and volatility can become chaotic. Therefore, a breakout in the first minutes after the release of important statistics does not always indicate a real market direction.
How to Use a False Breakout as a Trading Signal and Protect Yourself From It
A false breakout doesn’t always need to be seen only as a problem. Sometimes it becomes a trading signal on its own. If price breaks a level, collects stops and pending orders, but fails to hold further, it can mean that the market didn’t have enough strength to continue the move. In such cases, traders often look for an opportunity to trade in the opposite direction — not with the breakout, but against it.
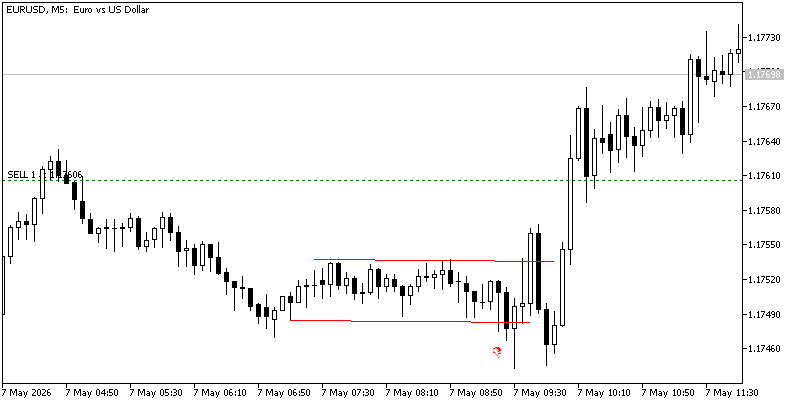
For example, price breaks resistance upwards, but the candle closes back below the level. This could be a signal that buyers couldn’t hold the price, and sellers regained control. In such a situation, some traders look for a selling opportunity. In the case of a false support breakout, the logic is the opposite: price moves below the level, but quickly returns above it, showing the weakness of sellers and possible interest from buyers.
To confirm this scenario, candlestick patterns are often used. A long wick beyond the level may show that the market made a penetration, but it was quickly bought or sold back. A pin bar near the level, engulfing, or a strong close back into the range can strengthen the signal. However, it’s important not to enter based on a single candle: it’s better to consider the overall trend, the higher time frame, and the location of nearby levels.
- Wait for the candle to close beyond the level. Just a penetration of the level alone does not confirm a breakout. Price may briefly move above resistance or below support, trigger orders, and quickly return. Therefore, it’s safer to look not only at the candle’s wick, but also at its closing. If the candle closes beyond the level and the next one supports the movement, the signal looks stronger.
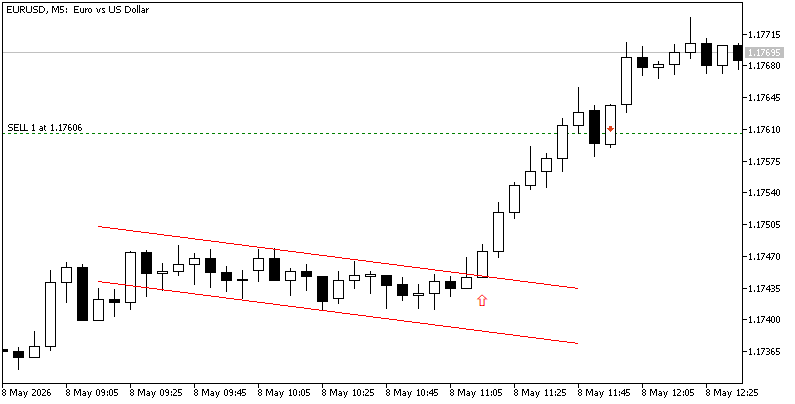
- Use a retest after the breakout. A more cautious approach is not to enter immediately at the moment of the breakout, but to wait for the price to return to the breached level. If resistance becomes support after the breakout, it may confirm the strength of buyers. If support becomes resistance after the breakout, it may confirm the strength of sellers. Entering after a retest often provides a clearer stop-loss point.
- Look at the higher time frame. False breakouts are usually more common on lower time frames. What looks like a breakout on a 5-minute chart may appear as just a candle wick on an hourly or daily chart. Therefore, it’s useful to check whether the signal aligns with the overall picture on the higher time frame before entering. If the breakout goes against a strong level on the higher chart, the risk of a false move is higher.
- Don’t trade before major news without a plan. Before the release of data on inflation, interest rates, employment, GDP, or central bank decisions, the market often becomes sharp and unstable. In such moments, levels may be broken randomly, and the price may quickly return. If a trader doesn’t have a specific news strategy, it’s better to reduce the trade size or avoid opening new positions before important releases.
- Consider the spread and volatility. Sometimes an order triggers not because the level is actually broken, but due to a widened spread or a brief spike in volatility. This is especially important when trading during news events, at night, or on less liquid currency pairs. Stop losses and pending orders should not be placed too close to obvious levels where price may make a regular technical penetration.
- Place your stop loss behind a logical area, not randomly. A stop that is too tight can often knock a trader out of a trade even with a correct idea. When trading breakouts, it’s better to place the stop not just a few pips away from the level, but behind an area where the scenario would actually be invalidated. When trading a false breakout, the stop is usually placed behind the penetration extreme: above the wick after a sell trade following a false resistance breakout or below the wick after a buy trade following a false support breakout.
- Don’t use one signal without confirmation. A false breakout is better evaluated in context. If there’s a return to the level, a strong candle close, a reaction on the higher time frame, and a clear risk-reward ratio, the signal becomes more justified. If there is only a short penetration of the level without additional confirmation, the entry will look more like a guess than a trading plan.
The main principle is not to rush. A breakout becomes more reliable not at the moment of the first touch of the level, but when the market shows readiness to continue the move. Discipline, risk management, and a well-thought-out plan help not avoid all false signals, but significantly reduce their impact
FAQ
What is a false breakout?
A false breakout occurs when price temporarily moves beyond a support or resistance level but quickly returns to the original range, misleading traders into entering positions that result in losses.
Why do false breakouts happen?
False breakouts often occur due to accumulated orders at key levels, low liquidity, or market volatility from news events, causing temporary price movements that lack sustained momentum.
How can traders protect themselves from false breakouts?
Traders should wait for confirmed closes beyond a level, use higher time frames for context, avoid trading before major news without a plan, and place stop-losses behind logical areas rather than near obvious levels.


