


Technical levels on charts are built by everyone—both experienced traders and green beginners. Building support and resistance levels is probably the first thing a trader learns when entering the foreign exchange market.
Not Levels, but Zones
Experts from Fortrader magazine remind readers of the definition of a price level in the foreign exchange market.
Notice the words “area or zone of values”—this is where the trick lies. Drawing a line on a chart through a maximum or minimum defines a specific price value, which determines whether a breakout or retracement has occurred.

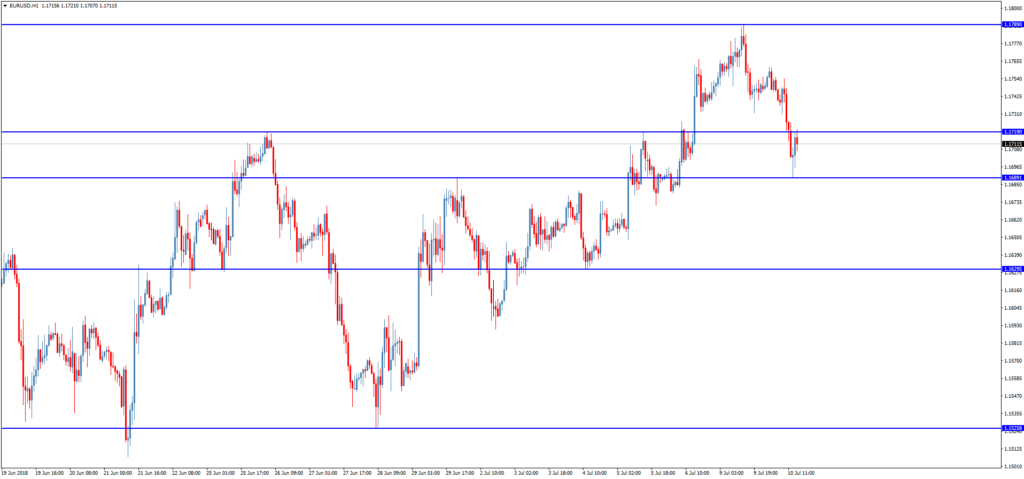
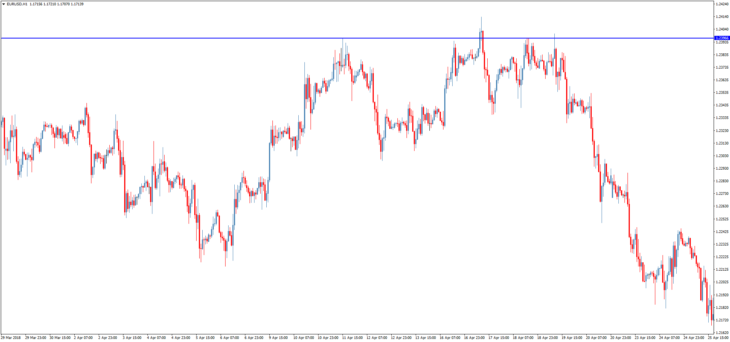
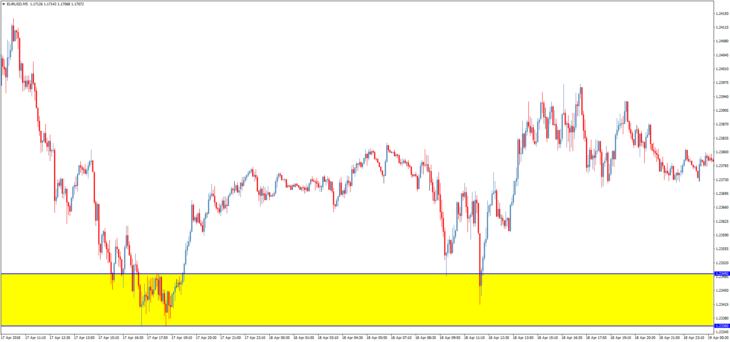
For better understanding, take one of the levels built on the hourly chart. For example, this is a resistance level in the EUR/USD pair built at a price of 1.23966.
Now look at the same level on a smaller time frame. As you can see, it works slightly differently than on H1.
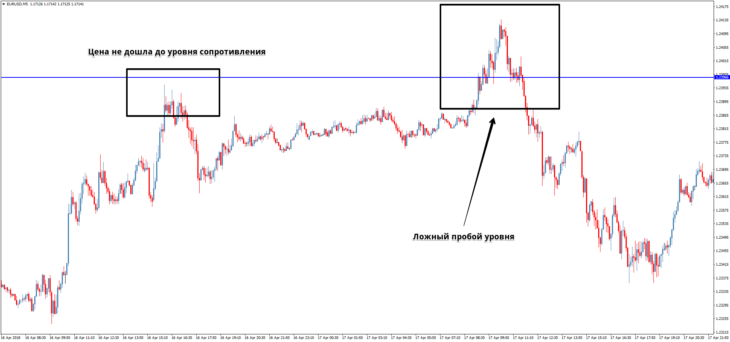
In the first case, a trade could have been opened on a short position on a bounce from the resistance level, but the trader did not do so because the price did not reach the level they had drawn. In the second case, a long position would have been opened on a breakout of the level. At best, it would have brought very little profit or closed at a break-even. At worst, it would have resulted in a loss.
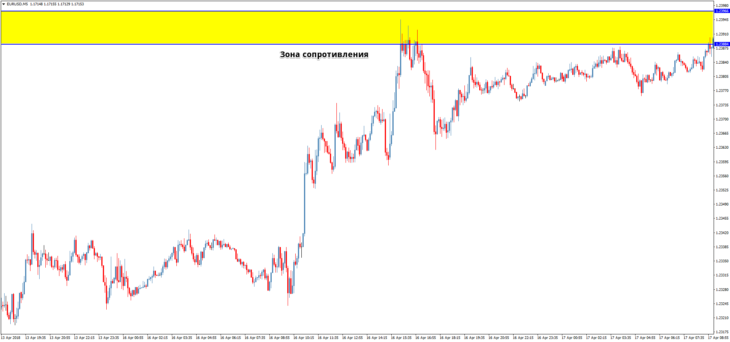
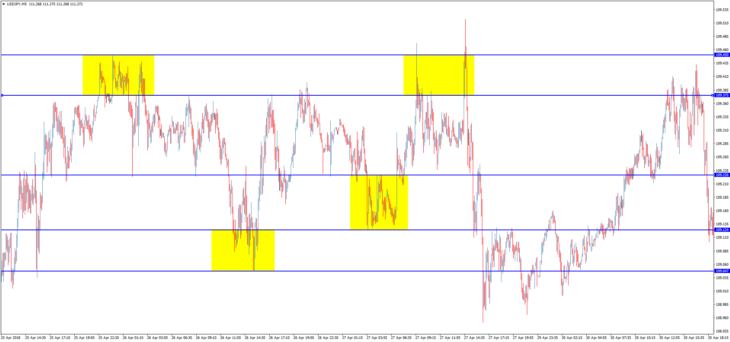
But if the resistance had been built as a zone rather than a line, the picture would look completely different. It is clearly visible that the price could not overcome the resistance zone, and in this case, a short trade on a bounce from the zone would have been opened.
Where Do Support and Resistance Zones Come From
Every trader knows that technical analysis is the foundation of trading. Ask any trader, and they will tell you immediately that a take-profit order should be placed near the opposite trend line, and a stop-loss order should be placed above or below the previous local high or low.
And there are millions of such traders in the foreign exchange market. These are exactly the places where traders place their take-profits and stop-losses.
Clusters of these orders are very important—when the price reaches them, hundreds of thousands of stop-losses trigger almost simultaneously. Consequently, the price receives a significant impulse for further movement.
However, traders are not robots, so stop-loss values differ, although they are within a narrow range. This range is the support or resistance zone.
It is quite easy to build these price zones. Just find the appropriate price reaction on the chart and highlight the corresponding zone. Scroll through history—you will see that the zones you have drawn actually work and are much more effective than lines drawn through extremes.
Conclusion
Using support and resistance zones in trading allows a trader to see the market picture more clearly and not miss a signal to open a position, unlike a trader who uses regular technical levels. The classic trader simply won’t open a trade because the price hasn’t reached their level.
Support and resistance zones will work on any time frame, with only the width differing. Try this method, and you’ll see that your trading has become even more efficient and profitable.
Learn from the experts at Fortrader and read updates first in our Facebook feed!
FAQ
What are support and resistance zones?
Support and resistance zones are areas on a chart where price tends to reverse or pause, based on historical price reactions.
Why use zones instead of lines?
Zones account for price fluctuations and provide a more accurate representation of potential price behavior compared to single lines.
How do I identify support and resistance zones?
Look for areas where price has previously reversed or stalled, and mark those as zones on your chart.


