Pro Parabolic SAR Trend Trading Strategy uses two indicators to generate clear buy and sell signals for Forex pairs, cryptocurrencies, and binary options. It follows trends with simple rules ideal for beginners on 15-minute charts and higher.
Trading Parameters
- Currency pairs: any, including cryptocurrencies
- Timeframe: M15 and higher (for binary options, expiration time is 2-3 candles)
- Trading time: London, New York
- Risk management: after calculating the stop-loss, choose a lot size so that the risk does not exceed 2-5% of the deposit per trade
Indicators Setup
For market analysis, use these indicators from the archive at the end of the article:
- Pro Parabolic Sar (0.01- 0.1, Price High 2, Price Low 3)
- Blau indicator: (4, 1, 9)
Chart Setup
To install indicators quickly and correctly, use the trading template:
- Unpack the archive
- Copy the template to the templates folder
- Copy the indicators to the MQL4 -> indicators folder
- Restart the terminal
- Open the chart of the desired currency pair
- Apply the template named Pro Parabolic Sar
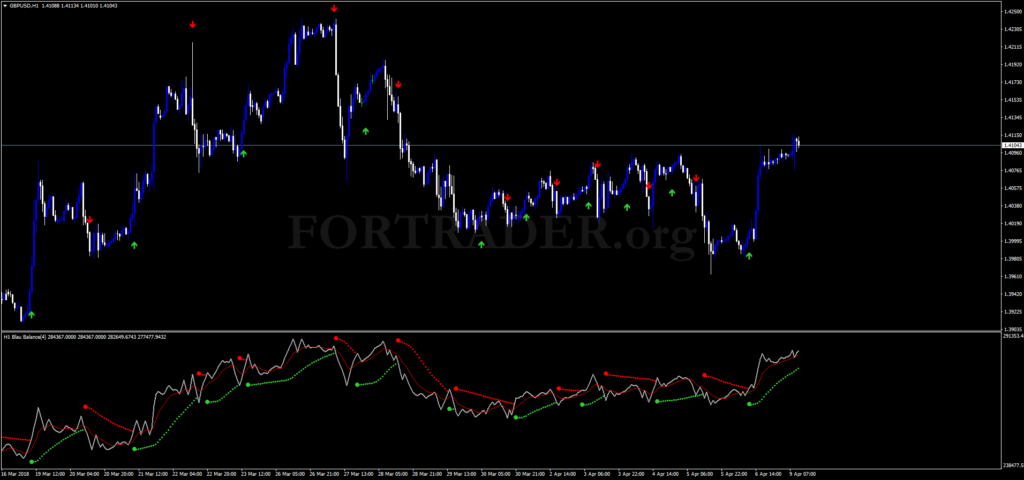
The chart should look like this:

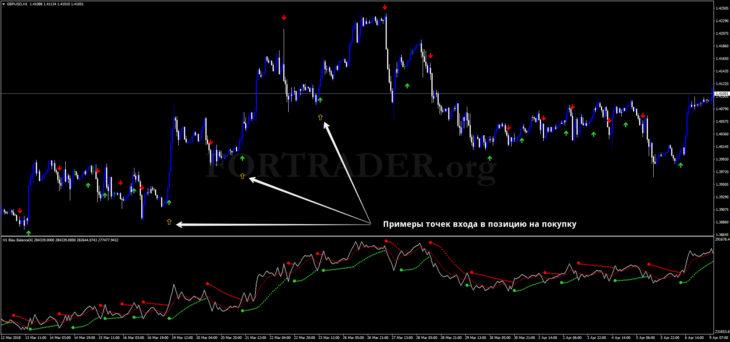
Buy Signals (Call Options)
Enter long positions when:
- A green upward arrow appears;
- The Blau indicator line consists of green dots.
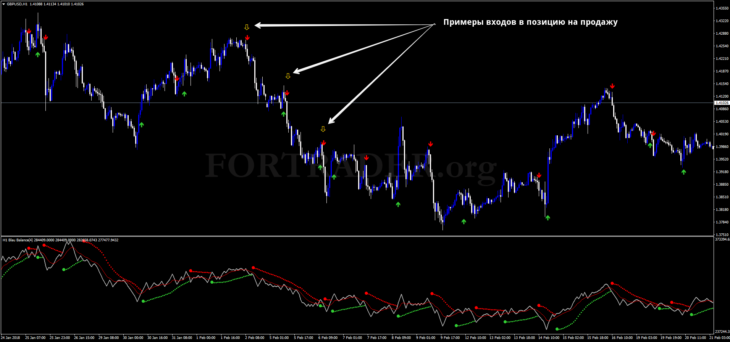
Sell Signals (Put Options)
Enter short positions when:
- A red downward arrow appears;
- The Blau indicator line consists of red dots.
Stop-Loss and Take-Profit Rules
Use protective orders or manual management:
- Set stop-loss above/below the previous high/low; use trailing stop recommended;
- Set take-profit near trend support/resistance, or close on Pro Parabolic Sar reverse signal.
This trend-following strategy produces false signals in ranging markets. Add a trend filter to reduce them. Test on demo before live trading.
Download the Pro Parabolic Sar strategy template and indicators
FAQ
What timeframes work best with Pro Parabolic SAR strategy?
M15 and higher; for binary options, use 2-3 candle expirations during London and New York sessions.
How do I identify buy and sell signals?
Buy on green upward arrow with green Blau dots; sell on red downward arrow with red Blau dots.
What risk management does the strategy recommend?
Risk 2-5% per trade; set stop-loss at prior high/low with trailing, take-profit at support/resistance or reverse signal.