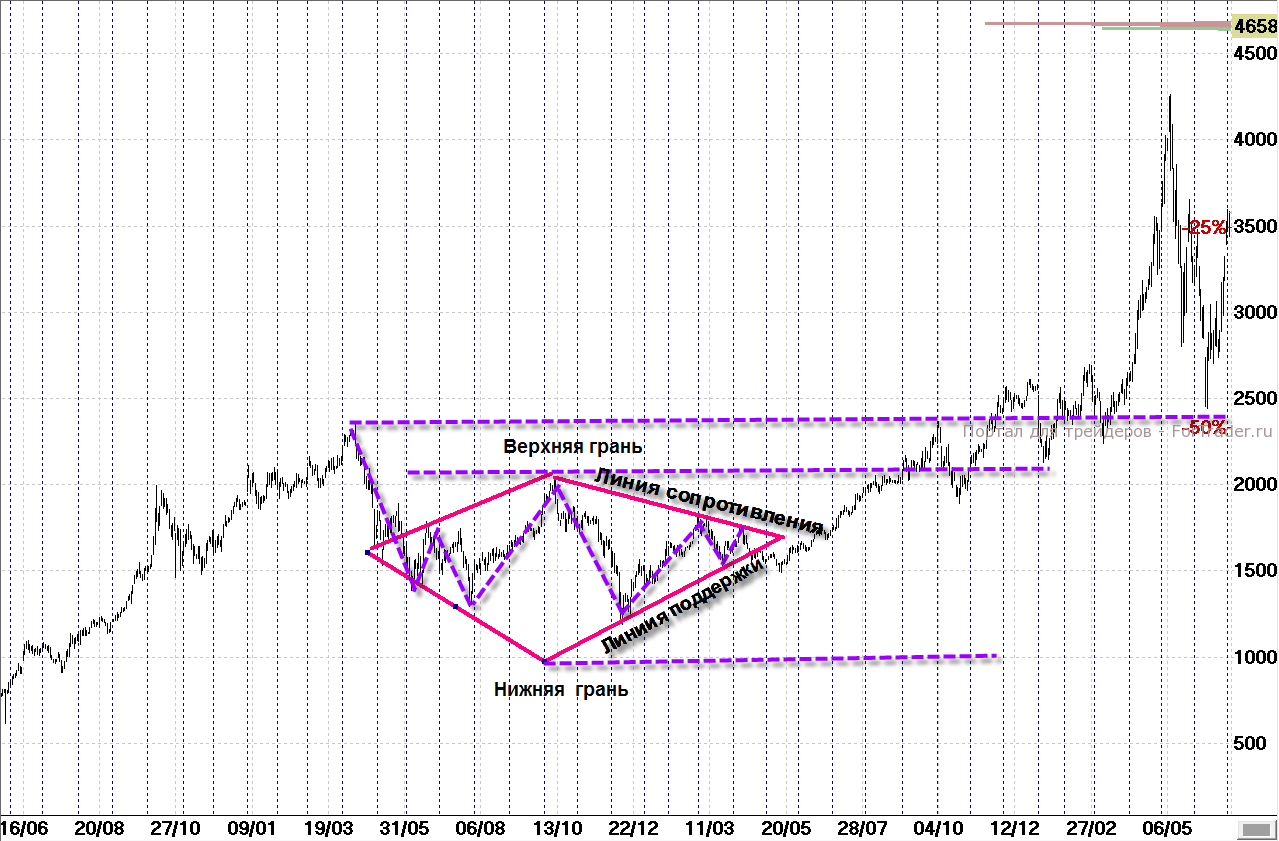
As promised last time, today I will discuss what happens when the cunning expanding formation merges with an equally cunning symmetrical triangle. The situation is simple: a rare and little-studied pattern on daily charts of Russian stocks, the Diamond or Rhombus trend reversal pattern, appears.
Rules for Building the ‘Diamond’ Pattern

The ‘Diamond’ pattern is unusual because its formation takes a long time. Russian stock prices are too emotional to remain in limited ranges for long. In classical technical analysis literature, you can find not only the conditions for forming and describing the Diamond or Rhombus pattern but also learn what market gurus recommend doing when prices break out of the formation. Some measure the diagonal of the pattern and project it from the breakout point of one of the boundaries, while others rely on the size of the trend that was active before entering the pattern.

I prefer to trade what has been and still is! That is, I look at past and present charts to understand the individual characteristics of how stocks behave in certain situations. I don’t claim to have the final truth, because for me it’s difficult to spot Diamonds, and if I do, it’s on my working daily charts. On smaller timeframes, the events after the pattern may be different, but you can determine this yourself if your trading strategy requires it.
Practical Application Features of the ‘Diamond’ Pattern on the Russian Stock Market
So, what do the ‘Diamond’ patterns look like and how do they play out on the charts of Russian stocks?
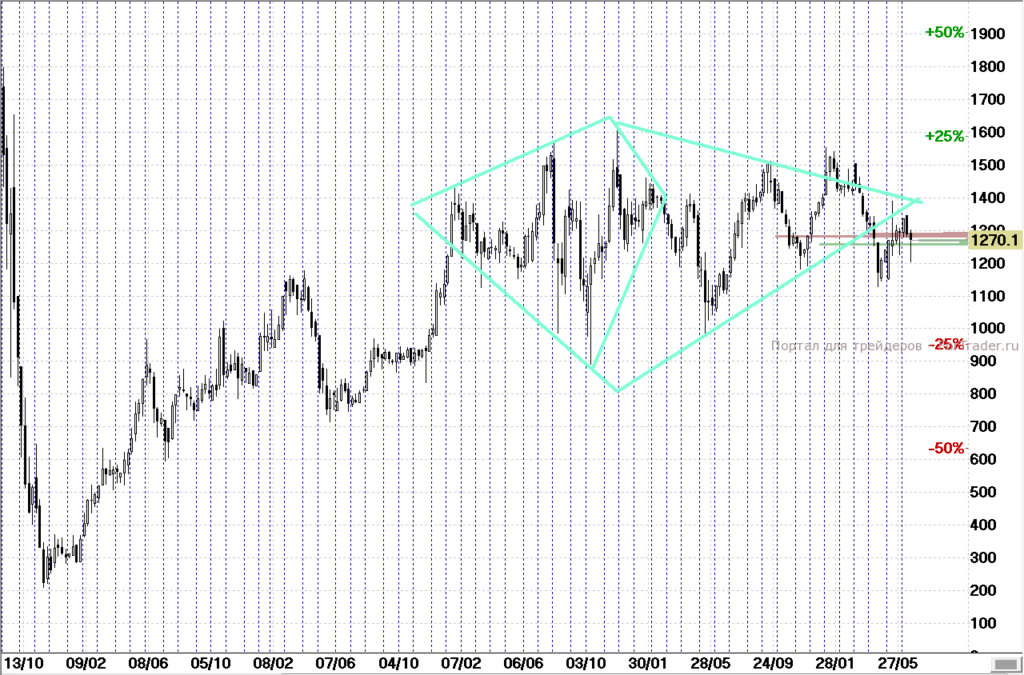
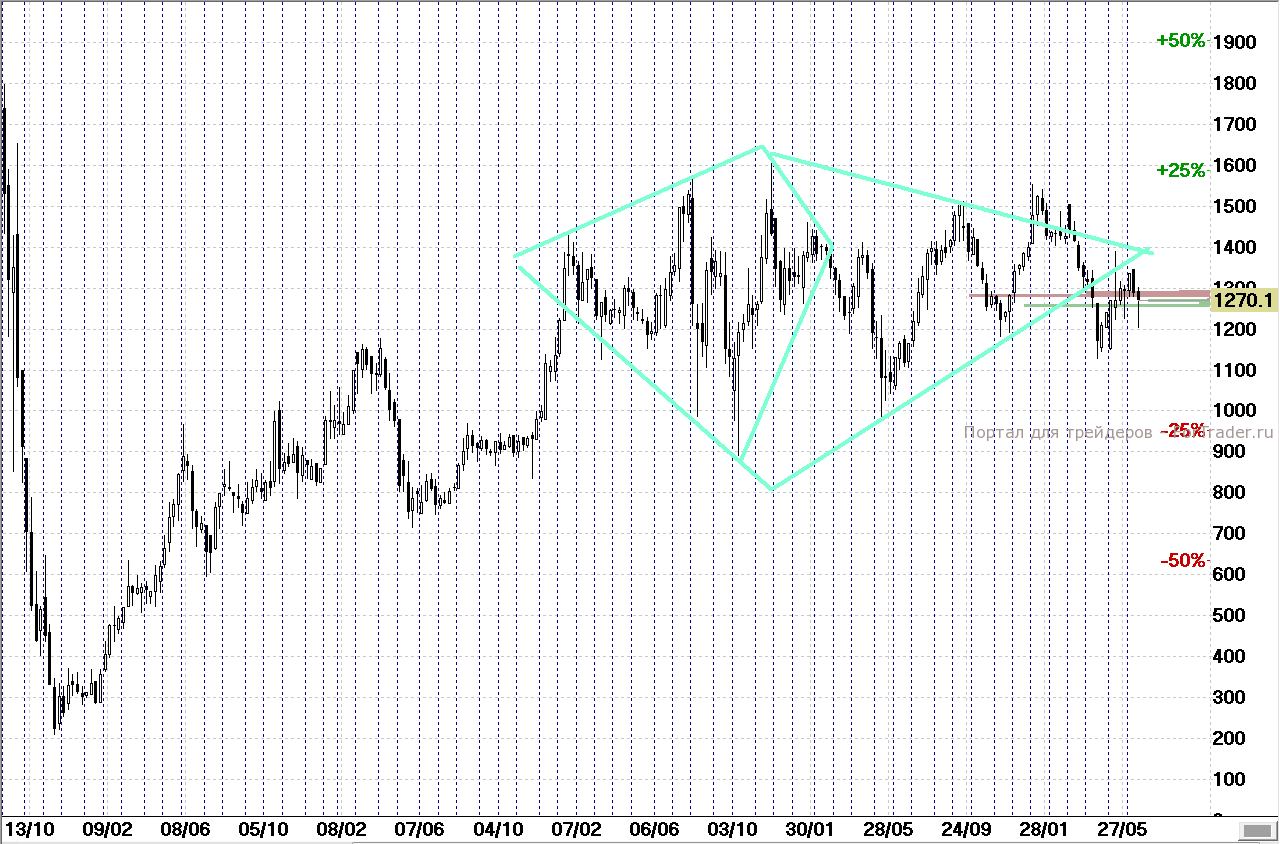
Let’s start with stocks that most closely resemble the classic representation of the figures after the appearance of Diamonds (Rhombuses) – these are the shares of Norilsk Nickel.
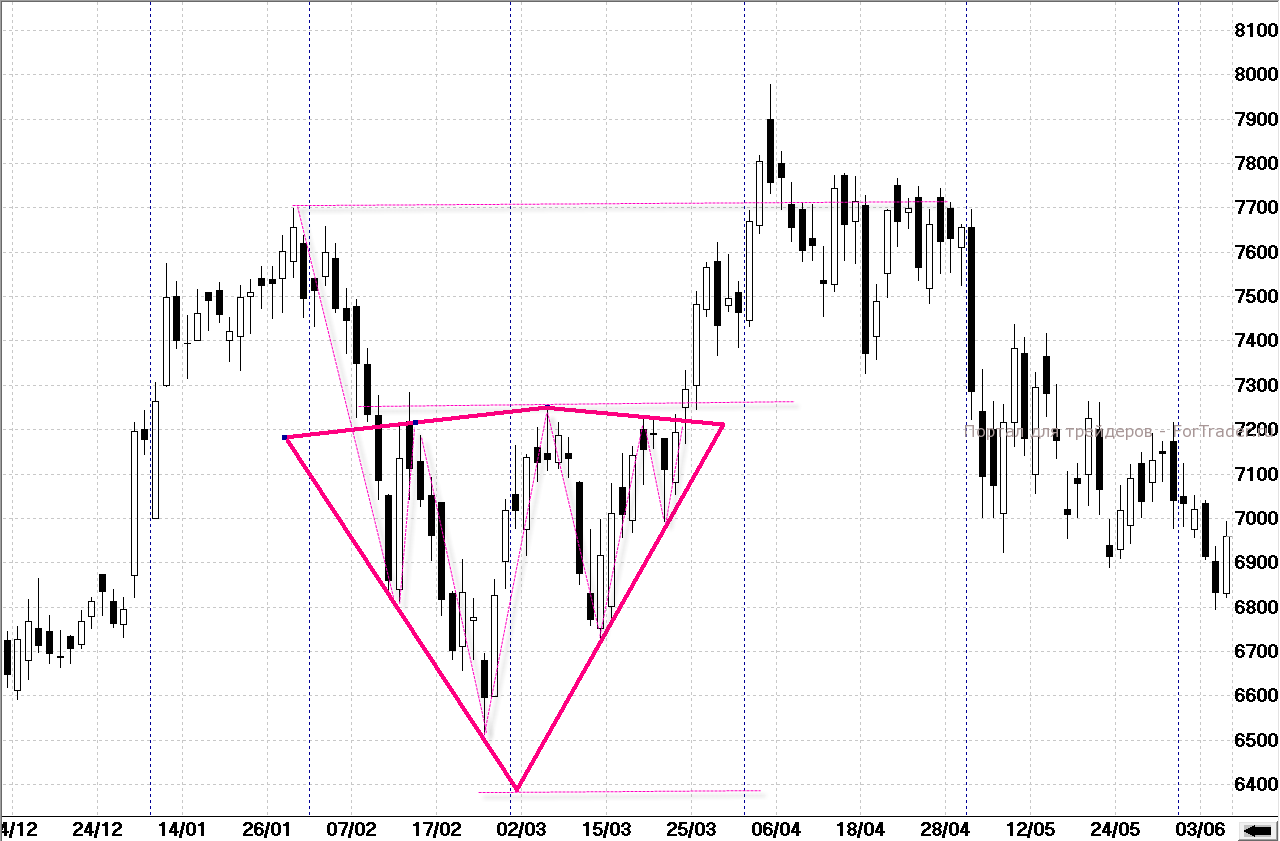
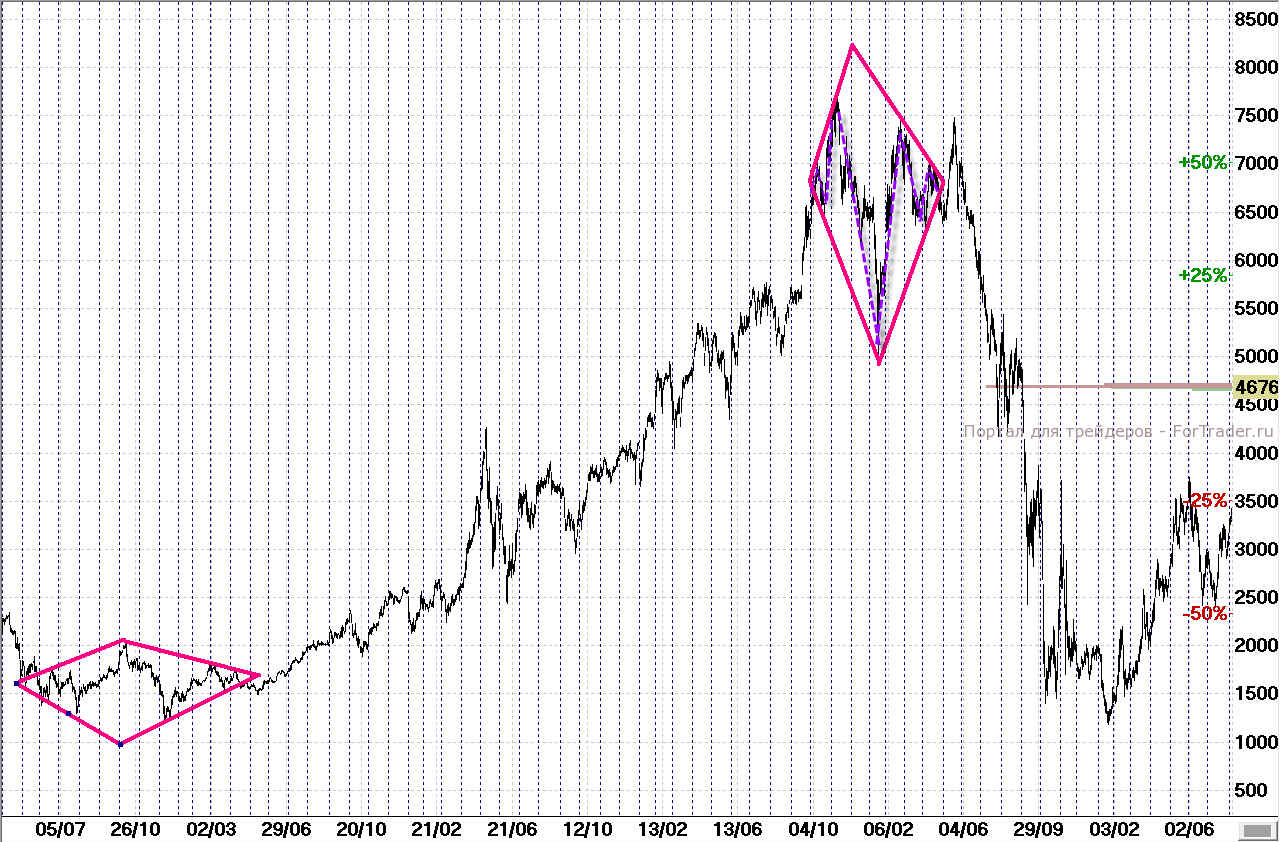
As you can see on the previous figures, after some trials, the shares of Norilsk Nickel traditionally returned to the beginning of the trend preceding the considered pattern. The treachery of the ‘parents’ of the pattern (‘symmetrical triangle’ and ‘expanding formation’) is evident here. On two out of three charts, you can see false movements of the shares before they make a retracement.
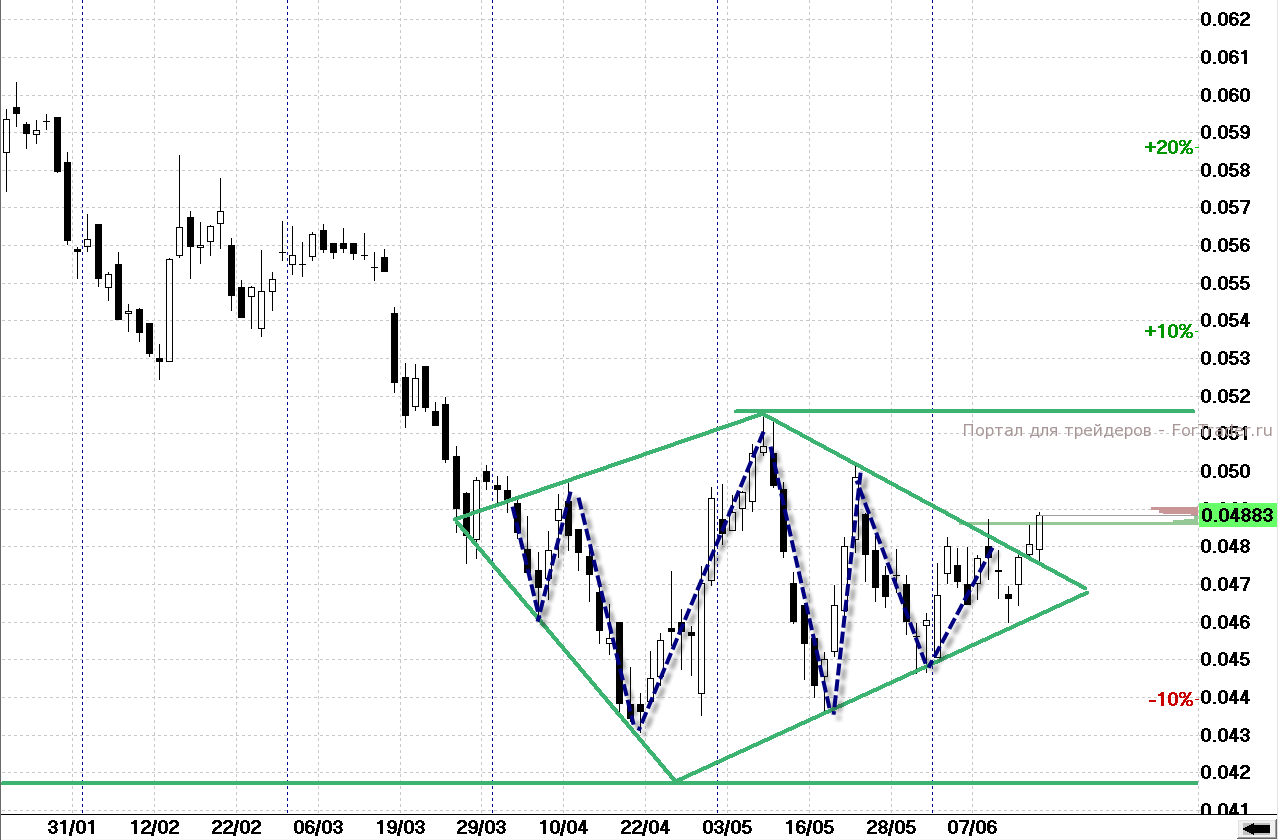
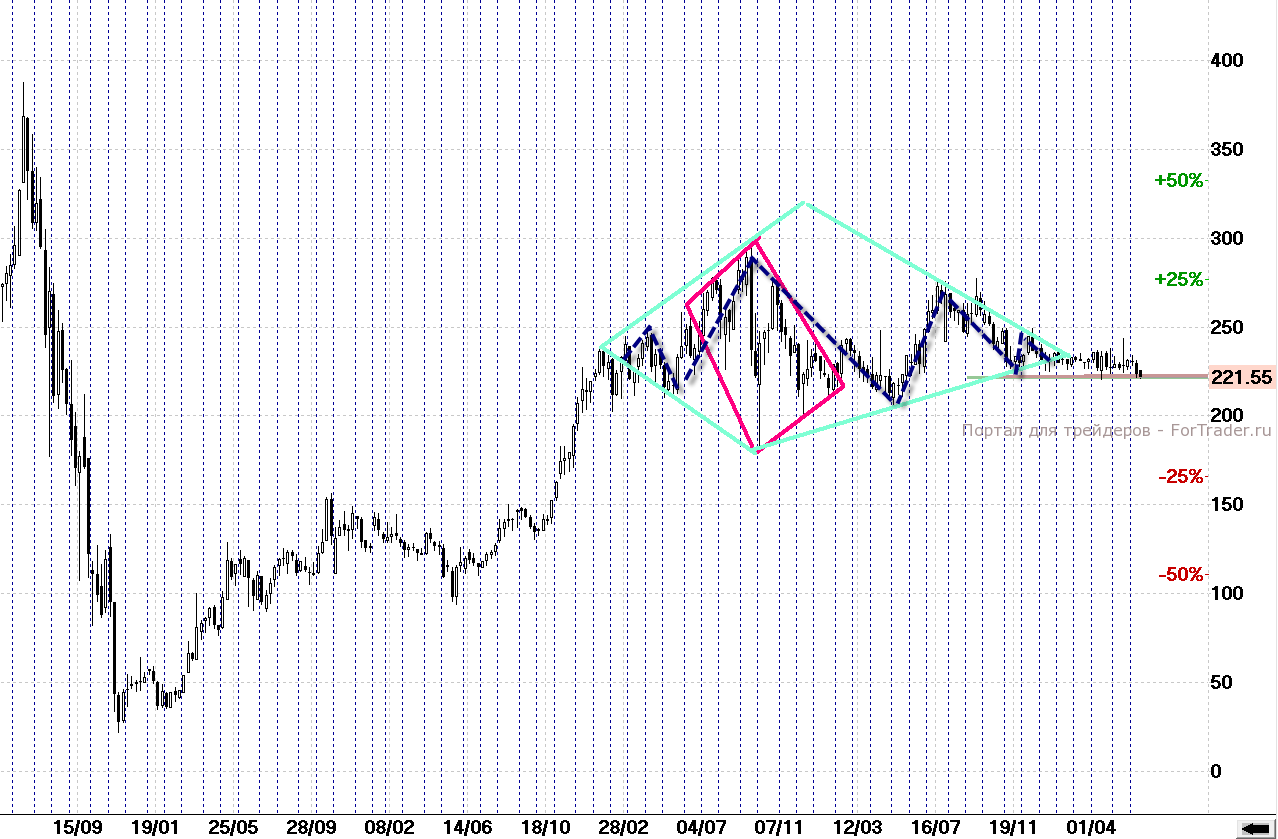
Nevertheless, this is not the worst scenario. The situation after the Diamond was more complicated and is still developing on the Uralkaliy chart.
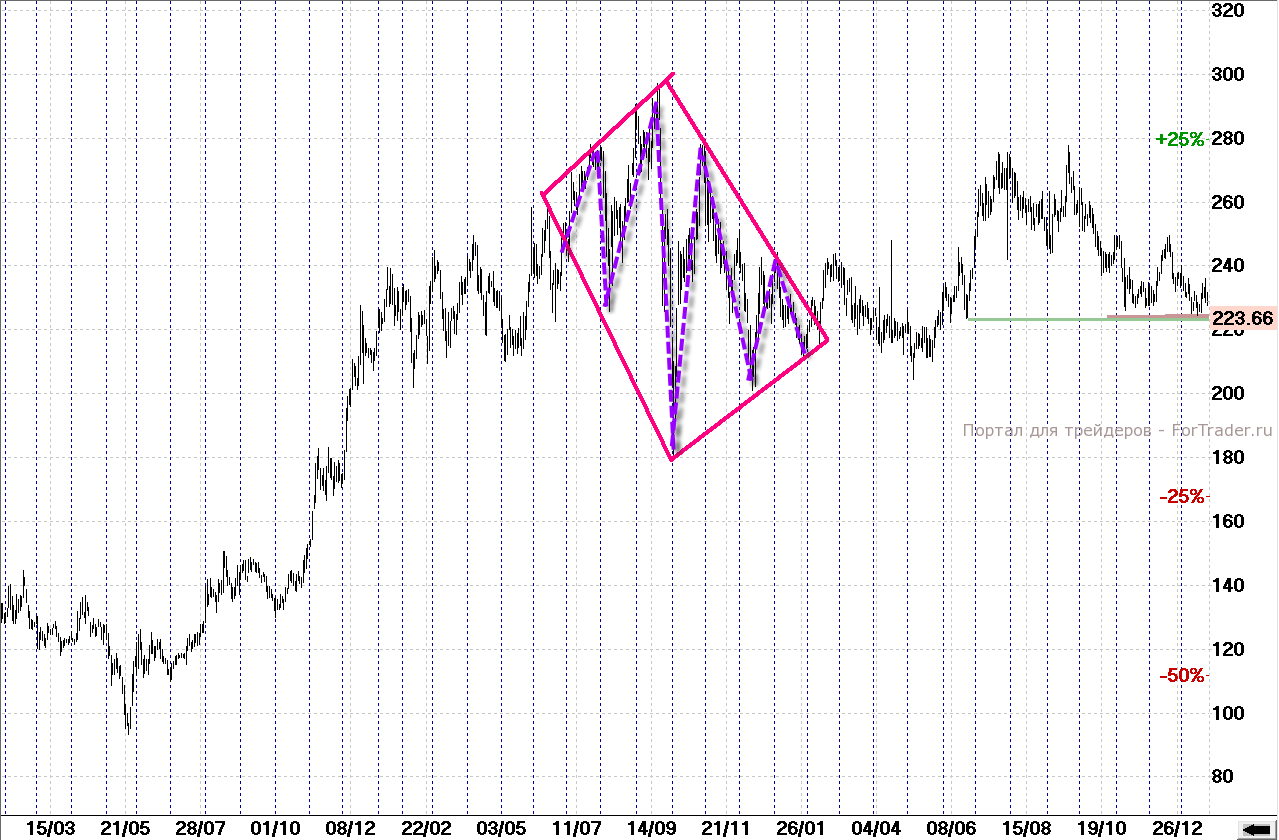
Here, the ‘Diamond’ pattern itself seemed to emerge from a sideways trend, but it also contained a sideways movement. Those who bet on price increases after breaking the resistance line of the Diamond pattern could have suffered losses of up to 10.4%, while paper profits did not exceed 24%. A year has passed since exiting the Diamond, and volatility has decreased. The image has taken on surprising shapes: the old pattern became part of a new Diamond. It is better to view it on the weekly chart of the issuer.
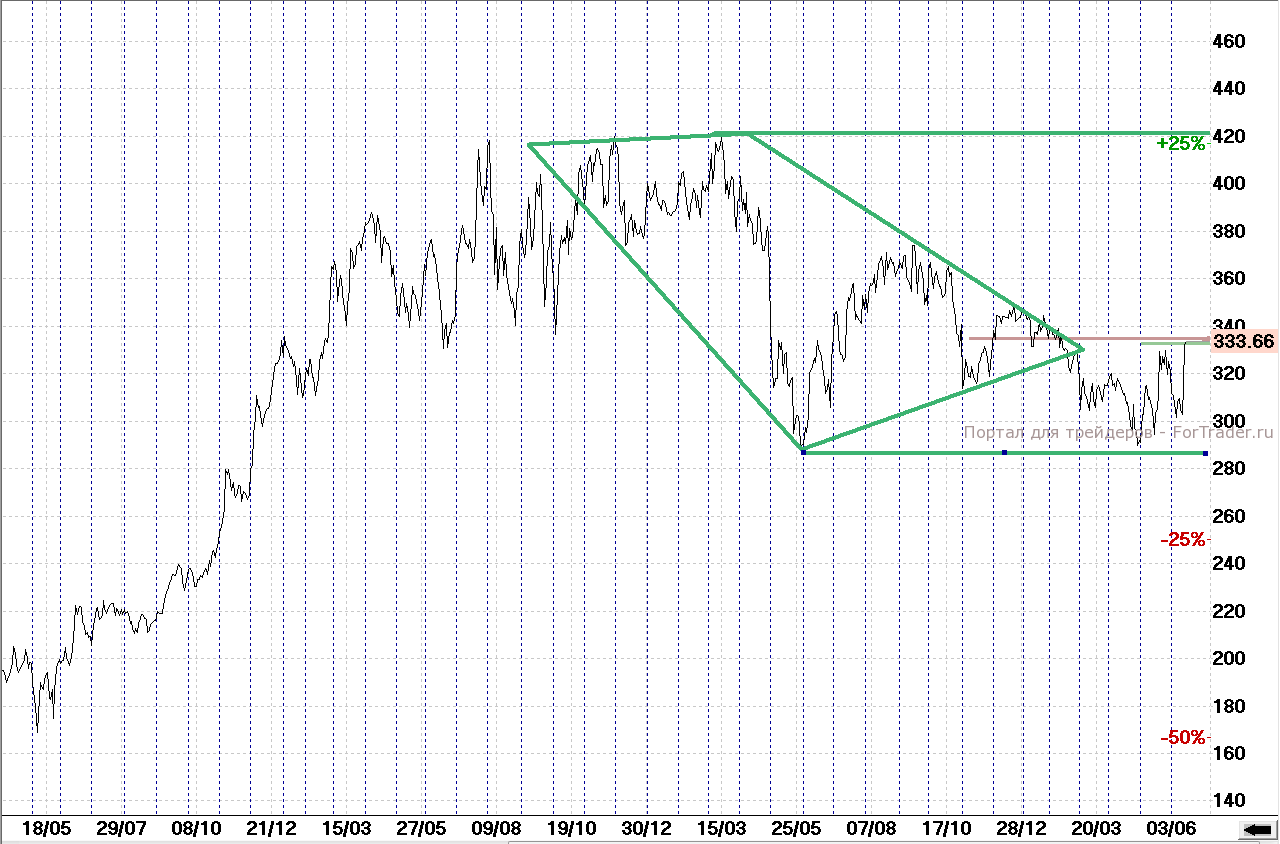
On the weekly chart of Uralkaliy’s counterpart, Akron, the Diamond pattern
FAQ
What is the Diamond or Rhombus pattern?
The Diamond or Rhombus pattern is a rare trend reversal formation that combines an expanding formation with a symmetrical triangle, often seen on daily charts of Russian stocks.
How is the Diamond pattern identified?
The pattern is formed over a long period and involves a diagonal shape. Traders look for breakouts from the boundaries and use the pattern’s size to project potential price movements.
What are the implications of the Diamond pattern on Russian stocks?
On some stocks like Norilsk Nickel, prices often revert to the trend before the pattern. However, on other stocks like Uralkaliy, the pattern can lead to complex and prolonged price movements with potential losses or volatility.