


What Is a Flat in Forex?
Sideways Trend (Neutral) is also known as a flat (from the English word ‘flat’). A sideways trend reflects a stage in the development of the price of securities and other assets, where price fluctuations are minimal over a long period. This usually happens due to uncertainty in global trends.
Sideways trend is contrasted with upward or downward. In technical analysis, a neutral trend is represented using a sideways channel.
How to Recognize and Identify a Neutral Trend?
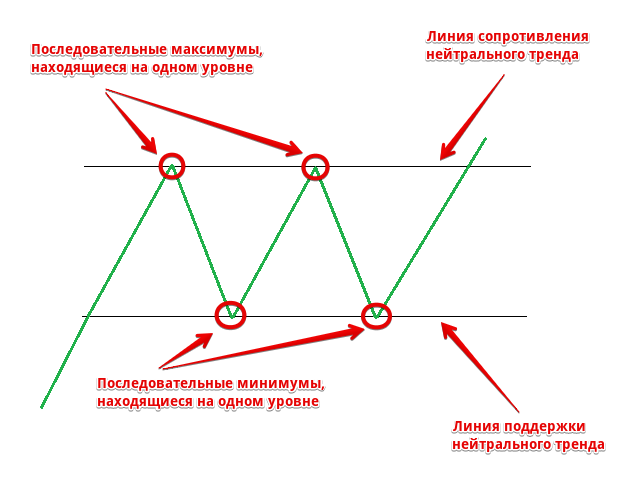
A sign of a neutral trend or flat on a price chart is a sequence of price highs and lows that are approximately at the same level.
A neutral trend on a currency pair’s price chart, like other types of trends, is marked by support and resistance lines drawn through the lows and highs, respectively, and are horizontal.
How to Trade in a Sideways Trend?
Flat in Forex is a time when bulls and bears have roughly equal strength and are not enough to form an upward or downward trend, so the price does not have a clear direction.

Usually, during a neutral trend, traders, especially those who prefer a trend trading style, do not trade because the profit from price changes is minimal. However, trading in a flat is popular among traders who prefer channel trading strategies.
Trading in a sideways trend involves:
- buying at support lines,
- selling at resistance lines.
It should be noted that a break of a technical line can indicate the start of a new price trend, so pending orders may also be used for trading:
- BuyStop – upon breaking the resistance line of the flat,
- SellStop – upon breaking the support line of the flat.

Never ignore stop-loss orders, as the price can form a false breakout and then return to the flat range.
Which Indicators Help Identify a Flat?
The best indicators for identifying a flat are forex oscillators, whose readings are within a range of 0 to 100 and have a central line.
Using indicators such as MACD or Stochastic, you can identify peaks and troughs of a sideways trend, as well as points where the flat will end.
 MACD Indicator, Euro/Dollar Currency Pair
In summary, a flat is a market condition where the forces of bulls and bears are roughly equal, and the price remains in a narrow range for a long time, waiting for a breakout. It is possible to trade profitably on such a market, either with short trades within the flat or on the breakout of the range.
FAQ
What is a sideways trend in forex?
A sideways trend in forex is a market condition where prices remain within a narrow range without a clear upward or downward movement.
How can I identify a flat in forex?
You can identify a flat by looking for price levels that remain relatively stable over time, forming support and resistance lines on a chart.
Can I trade during a sideways trend?
Yes, traders can profit during a sideways trend by using channel strategies, buying at support levels and selling at resistance levels.


