Masterclass: Exchange Technical Indicators. Indicator 4
The Relative Strength Index (RSI) is one of the most popular oscillators created by Welles Wilder. RSI measures the relative change in the highest and lowest closing prices.
The range of the oscillator is from 0 to 100. The following zones are distinguished on the oscillator chart:
- Overbought zone – values above 75 – considered optimal for selling.
- Oversold zone – values below 25 – considered optimal for buying.
In strong trends, the overbought and oversold zones are 80 and 20, respectively, while in sideways price movements, they are 70 and 30.
Formula for Calculating RSI Values
The main formula for calculating the Relative Strength Index (RSI):
RSI = 100 – (100 / (1 + U / D)), where:
- U – average value of positive price changes;
- D – average value of negative price changes.
Interpreting RSI Signals
In technical analysis of charts, the following RSI signals are distinguished:
– Peaks and Troughs
Peaks on the oscillator chart often form in the overbought zone, while troughs form in the oversold zone. These often precede the corresponding peaks and troughs on the price chart.
– Chart Patterns
Technical analysis chart patterns (e.g., head and shoulders, triangles) can form on the RSI chart but may not appear on the price chart.
– Breakouts of Support or Resistance Levels
Sometimes on the oscillator chart, RSI rises above the previous high and forms a new peak, or falls below the previous low and forms a new trough.
– Support and Resistance Levels
On the RSI oscillator chart, support and resistance levels can be more clearly visible than on the price chart.
– Divergences
When divergences occur, prices usually correct in the direction of the RSI oscillator movement.
Using the RSI Indicator
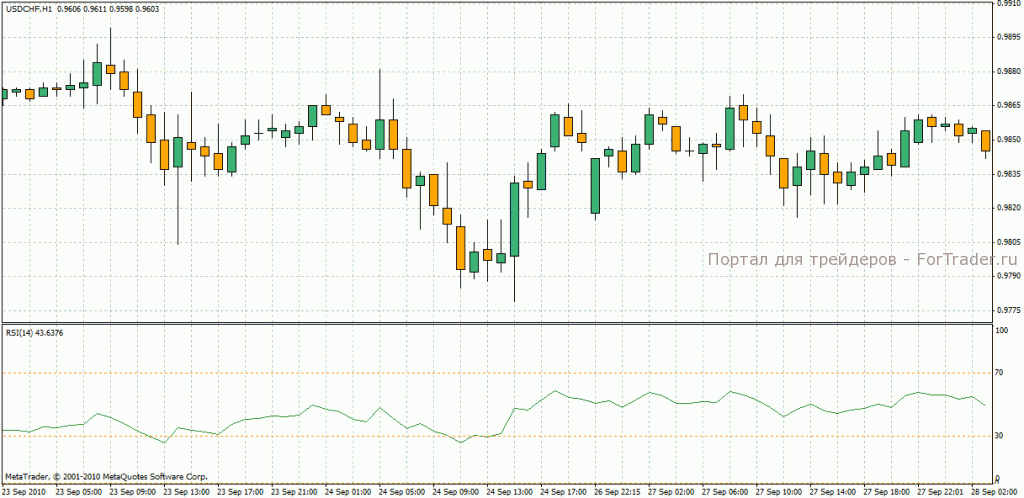
The creator of the Relative Strength Index, W. Wilder, recommended using a 14-period RSI oscillator. Later, 9-period and 25-period RSI became popular. The most common method of analyzing the oscillator involves looking for divergences, where the price forms a new high, but the RSI chart does not exceed the previous high. In this case, the divergence signals a potential price reversal. If after a divergence situation, the indicator turns downward and falls below its previous low, it completes what is known as a ‘failed move,’ which is considered a confirming signal of an upcoming price reversal.

Figure 1. The so-called ‘failed move’.
FAQ
What is the RSI oscillator?
The RSI oscillator is a technical indicator that measures the speed and change of price movements to determine overbought or oversold conditions in the market.
How is RSI calculated?
RSI is calculated using the formula: RSI = 100 – (100 / (1 + U / D)), where U is the average of positive price changes and D is the average of negative price changes.
What are the key RSI levels for trading?
The key RSI levels are 70 for overbought conditions and 30 for oversold conditions. However, these levels can vary depending on the market trend.