What are Technical Analysis Patterns?
Technical analysis patterns (patterns, Japanese candlestick models) are a graphical tool of technical analysis of financial markets that represent various repeating combinations of Japanese candles.
What Types of Technical Analysis Patterns Exist?
Technical analysis patterns can be divided into two categories:
- Patterns of trend continuation;
- Patterns of reversal.
In classical technical analysis, five main patterns are identified:
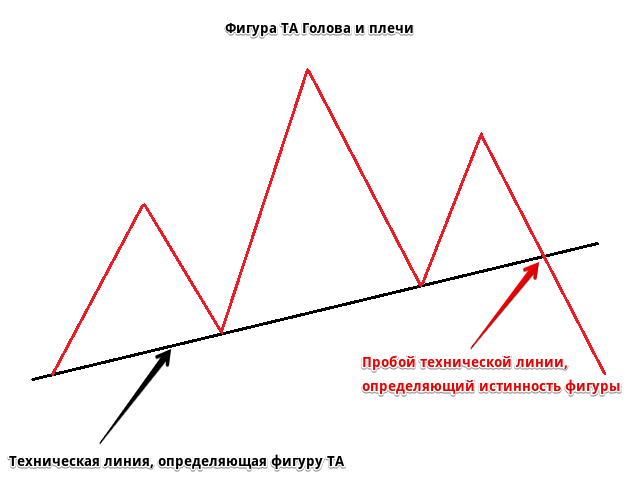
- Head and Shoulders;
- Double Top;
- Triple Top;
- Triangle;
- Flag.
All other technical analysis patterns are their derivatives. There are many technical analysis patterns actively used by traders, both classic and new, modern ones. The presence and market reaction to such patterns can often be explained economically, which is why they are regularities and appear on the markets under certain circumstances.
How to Use Technical Analysis Patterns?
The essence of using technical analysis patterns is reduced to specific actions by a trader who has recognized a pattern on the market. Pattern continuation requires opening a trade in the direction of the existing trend, while reversal patterns require opening a counter trade.
The main element of a technical analysis pattern is the resistance (support) line. A pattern is considered complete only after the price breaks through the technical line.

When the price breaks through the technical line, entering a position can be done in two ways:
- Aggressive (immediately after the breakout);
- Conservative (breakout – price returns to the line – bounce off it – entering the position).
The size of the take-profit order depends on the height of the pattern.
Advantages and Disadvantages of Using Technical Analysis Patterns?
Technical analysis patterns are a very powerful and effective tool for trading on financial markets.
The advantage of patterns is that they are built on classical principles of technical analysis without using any technical indicators, they are not redrawn or delayed, have high accuracy in processing formed technical analysis patterns, and often appear on currency pair price charts.
The disadvantages of patterns include their accuracy depending on the time frame. The higher the time frame, the higher the probability of processing the technical analysis pattern, however, they appear less frequently.
Alternative to Technical Analysis Patterns
The methodology of price patterns, based on slightly different principles, forms the basis of candlestick analysis (candlestick patterns, combinations of Japanese candles), Gartley harmonic patterns, and Price Action patterns. Combined with technical analysis patterns, these methods significantly increase the effectiveness of Forex trading.
More about Technical Analysis Patterns, Gartley Harmonic Patterns, Candle Combinations, and Price Action Patterns
Trading Strategies and Technical Indicators Using Technical Analysis Patterns
FAQ
What are technical analysis patterns?
Technical analysis patterns are graphical representations of price movements used to predict future market trends.
How do I use technical analysis patterns?
Traders use technical analysis patterns to identify potential market reversals or continuations and make informed trading decisions.
What are the advantages of using technical analysis patterns?
Technical analysis patterns offer a reliable method for predicting market behavior, helping traders make accurate and timely decisions.