NZDUSD stretched its seven-day rally to a more than two-month high of 0.6690 on Wednesday, remaining within the Ichimoku cloud. The price advanced above the bullish cross within the 20- and 40-simple moving averages (SMAs) and is trying to exit from the two-month congestion area of 0.6490 – 0.6680.
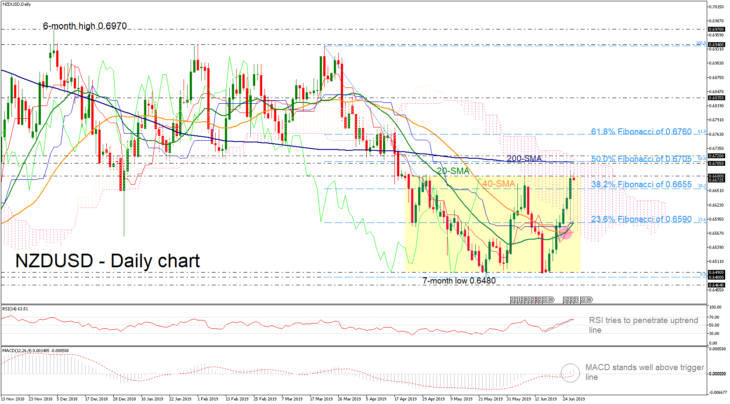
The near-term bias is looking neutral-to-bullish as the RSI is flatlining above the 50-neutral level, while the MACD is strengthening its positive momentum well above its trigger line, suggesting more upside pressure in the daily timeframe.
Should NZDUSD make another run higher, it’s likely to meet resistance at the strong area of the 200-day SMA and the 50.0% Fibonacci retracement level of the downfall from 0.6940 – 0.6480 at 0.6705. A successful break above this key area would open the way for the immediate resistance of the 61.8% Fibo of 0.6760 but before that the price might need to overcome another hurdle of 0.6720.
If the bullish movement fails to hold and prices turn lower, the 38.2% Fibonacci mark of 0.6655 is the nearest support that could halt steeper declines. A potentially more important support, though, is the 23.6% Fibo of 0.6590, which overlaps with the 20-day SMA. If breached, it would shift the focus to the downside and prices could slip until the lower bound of the range at 0.6490.
In the near-term picture, NZDUSD would need to make a sustained climb above the 200-SMA in order for the outlook to become convincingly bullish.

