Gold is reviving bullish momentum after an almost flat week, with the precious metal finally looking for a closure above the four-month old restrictive descending trendline that is part of a downward sloping channel before the Christmas and New Year’s festivities begin.
The RSI and the MACD are endorsing the positive move in the price (also in the 4-hour chart) as the former is resuming its upside direction above its 50 neutral mark and the latter is trying to expand above its signal and zero lines.
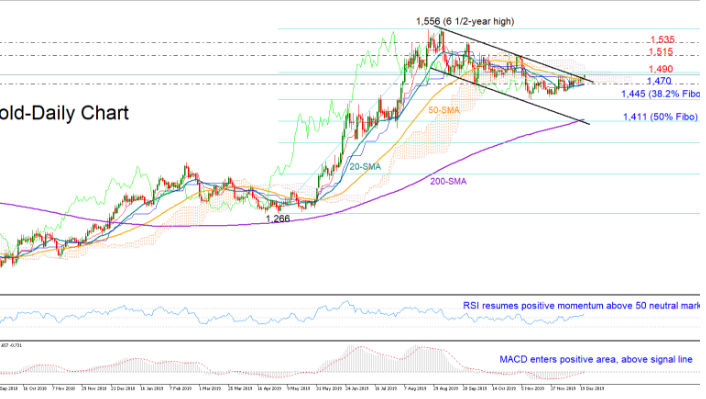
A decisive rally above the 1,490 barrier, which is near the 23.6% Fibonacci of the upleg from 1,266 to 1,556, and a clear peak above the Ichimoku cloud could add more fuel to the bullish pressure, shifting attention towards the 1,515-1,535 area. Higher, all eyes will turn to the 6 ½-year high of 1,556.
In the negative scenario, a downside reversal below the descending trendline and the 1,470 level where the 20-day simple moving average (SMA) currently flattens, could see a retest of the 38.2% Fibonacci of 1,445. Falling lower, the bears would aim for the bottom of the downward-sloping channel and the 200-day SMA – both located around the 50% Fibonacci of 1,411.
Looking at the three-month picture, the yellow metal is still slippery, making lower highs and lower lows. A break above 1,515 could increase speculation that the downtrend may be nearing an end, while a drop under 1,445 would enhance the bearish outlook.
Summarizing, gold seems to be at the start of a bullish wave. A closure above the Ichimoku cloud could confirm the improving sentiment in the short-term, while in the three-month picture, a rally above 1,515 is required to downgrade the negative outlook.

