EURGBP registered losses for the fourth consecutive week and bearish signals became stronger as the price failed to return above the upward support line, crossing instead under its shorter-term simple moving averages (SMA) and the Ichimoku cloud.
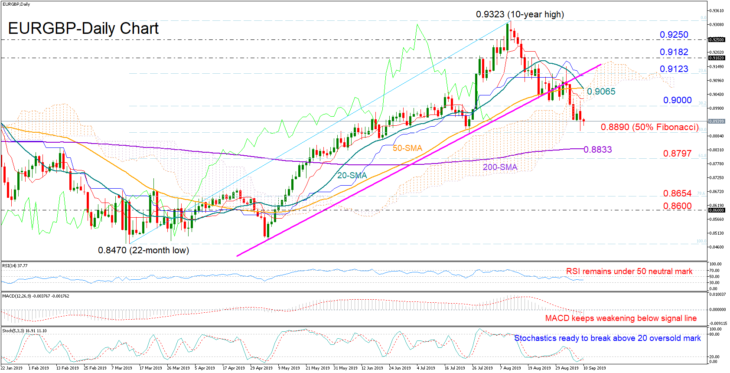
The 50% Fibonacci of the upleg from 0.8470 to 0.9323 managed to confidently curb downside movements on Monday and although the Stochastics are currently preparing to exit the oversold territory, the short-term bias remains skewed to the downside as the MACD maintains negative momentum under its red signal line and the RSI shows no clear direction in the bearish area.
A closing price under the 50% Fibonacci of 0.8890 could spark selling orders, shifting the target towards the 200-day SMA and the 61.8% Fibonacci of 0.8797. Moving lower, the decline could next stall somewhere between the 78.6% Fibonacci of 0.8654 and the 0.8600 round-level.
Alternatively, if the bears soon get exhausted, immediate resistance to upside corrections could be detected within the 0.9000-0.9065 area, which encapsulates the 38.2% Fibonacci, the 20-, and 50-day SMAs. Jumping back above the cloud and the 23.6% Fibonacci resistance of 0.9123, the bulls should knock down the wall between 0.9182 and 0.9250 in order to rechallenge the 10-year top of 0.9323.
Meanwhile in the medium-term picture, the positive sentiment has weakened but not faded yet as the pair continues to trade above the 61.8% Fibonacci of 0.8796.
Summarizing, EURGBP is likely to remain under pressure in the short-term, though losses could be limited as the market looks to be trading near oversold levels. In the medium-term picture, a drop under 0.8796 would shift the outlook from bullish to neutral.

