Crude oil prices had reached stability by Monday, December 2nd. On the last November day, Brent was losing almost 5%, but today the instrument is looking quite neutral and trading at 61.20 USD.
A little bit earlier, it became known that Saudi Arabia was extremely unhappy with non-compliance with oil production quotas by other members of OPEC+. For almost the entire 2019, Saudis had been underfulfilling their quota in order to eliminate the facts of overfulfilling the extraction by other countries. In September, the monitoring committee had a meeting where the cartel was discussing negative consequences of non-observance of deal conditions, but as one can see it was in vain.
It might well be that Saudi Arabia will take a tough stance on this issue – the country has a new energy minister, who may try to dictate his terms to the organization. Saudi Arabia is a significant force in OPEC and OPEC+, that’s why all other members will instantly feel the difference if Saudis stop making concessions.
Another thing that makes oil investors nervous in Russia. The country’s Minister of Energy, Alexander Novak, said recently that OPEC+ shouldn’t make any important decisions in December, because market conditions might significantly change in a couple of months. Earlier, shortly before extending the agreement on oil production freeze, Russia already made some controversial statements, thus increasing the market volatility.
Brent crude technically
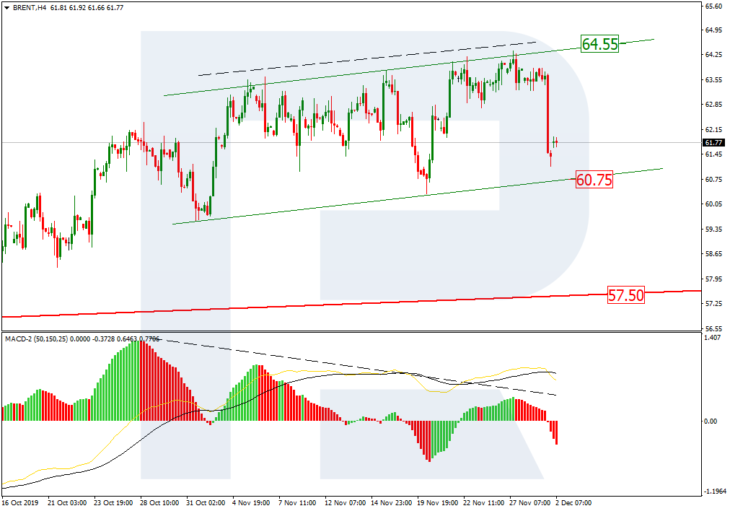
In the case of Brent, the key tendency may still be considered bullish, because the price is steadily trading inside the rising channel. Nevertheless, in the H4 chart we can see that after the pair tested the resistance line, there was a divergence on MACD, which made the price reverse and start a steady decline to test support level. The downside target is at 60.75. If later the pair breaks this level, it may fall to reach the long-term support at 57.50. However, one shouldn’t exclude a possibility that the instrument may rebound from the support level. In this case, the price may start a new rising impulse to reach 64.55 or even higher.
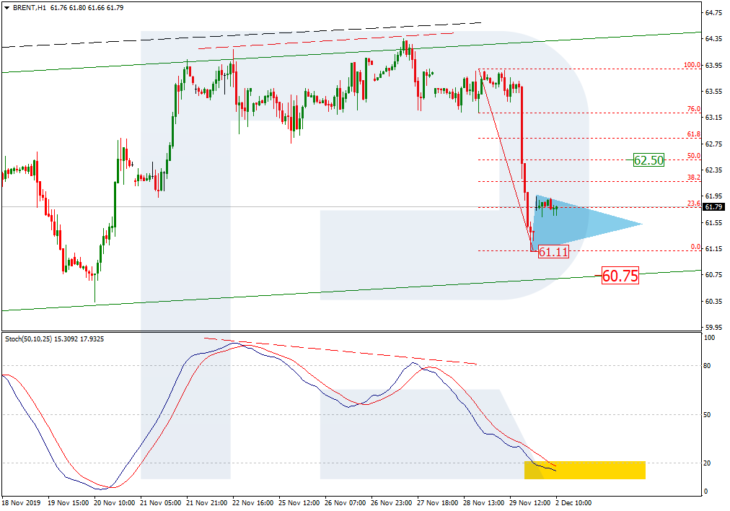
As we can see in the H1 chart, the Stochastic Oscillator is moving inside the “oversold area” and getting close to the support line, thus indicating a possible short-term pullback. The key correctional target may be 50.0% fibo at 62.50. If the pair breaks the local support at 61.11, the instrument may continue its decline.

