The binary options trading strategy ‘Day-Hour’ is based on the analysis of two timeframes (daily and 4-hour), with trading only taking place in the direction of the trend. You can use the analysis of the hourly H1 and 4-hour H4 timeframes for trading, but since this trading strategy was originally designed to work on D1 and H4, it is recommended not to chase larger profits and instead work on these timeframes. You can use any binary options on Forex with any currency pair for trading.
Tools for the Binary Options Trading Strategy
- Simple Moving Average (SMA) with a period of 3, set on the daily and 4-hour charts
- MACD indicator with values (15, 120, 5), set on the 4-hour chart
- RSI indicator with a value of 9. Also set on the 4-hour chart
Analysis Using the ‘Day-Hour’ Strategy and Trading
Initially, on the daily chart, find the closing price of the daily candle relative to the simple moving average SMA (3). Important point: if the previous day’s candle closed above the moving average, then on the 4-hour chart we will look for only buy signals (‘Call’). If the previous day’s candle on the daily chart closed below the moving average, then on the 4-hour chart we will look for only sell signals (‘Put’). It may also happen that it is difficult to determine where the candle closed, in which case the best option is to skip this day and wait for a clear signal.
After determining what type of trades we will be looking for on the buy or sell side. Move to the 4-hour chart and look at the indicators along with the chart:
- Check if the candle closed above or below the moving average
- Direction of the RSI indicator – up or down
- Signal from the MACD indicator – crossing of moving averages, i.e., the red line crosses the 0.00 level from top to bottom or vice versa
Example:
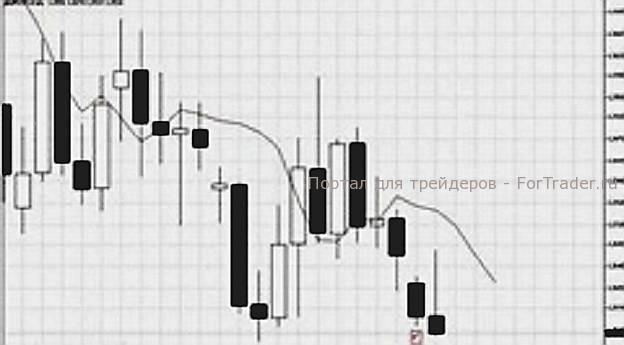
At the bottom, the previous day’s candle is marked, which closed below the moving average on the daily chart. This means today, on the 4-hour chart, we only look for sells.
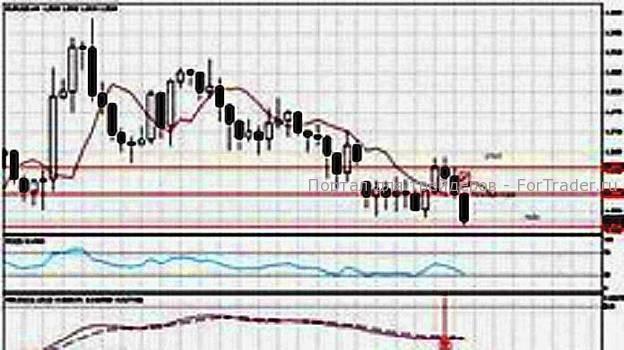
The first sell signal came from the MACD indicator when the main signal line (the dotted line on the chart) was crossed. However, at the same time, we see that the candle on the chart closed above the moving average at that moment. Therefore, we wait for confirmation when the price falls below the moving average. As a third confirmation, we look at the RSI indicator, which should be directed in the direction of the price movement, in this case downward. Only after you have a clear signal, that is, all three confirmations, you can confidently buy an option, in our case a ‘Put’.
“,
“excerpt”: “The ‘Day-Hour’ binary options strategy uses daily and 4-hour timeframes to trade in the trend.”,
“slug”: “binary-options-day-hour-strategy”,
“faq_html”: “
FAQ
What is the ‘Day-Hour’ binary options strategy?
The ‘Day-Hour’ strategy uses the daily and 4-hour timeframes to identify trends and make trading decisions based on technical indicators like SMA, MACD, and RSI.
How does the strategy work?
The strategy involves analyzing the daily chart to determine the trend direction and then using the 4-hour chart with technical indicators to confirm and execute trades in the same direction as the trend.
What are the key tools used in the ‘Day-Hour’ strategy?
The key tools include the Simple Moving Average (SMA), MACD indicator, and RSI indicator, each set to specific parameters to help identify and confirm trading signals.
”


