Market: Forex;
Currency Pairs: EUR/USD ;
Timeframe: Daily ;
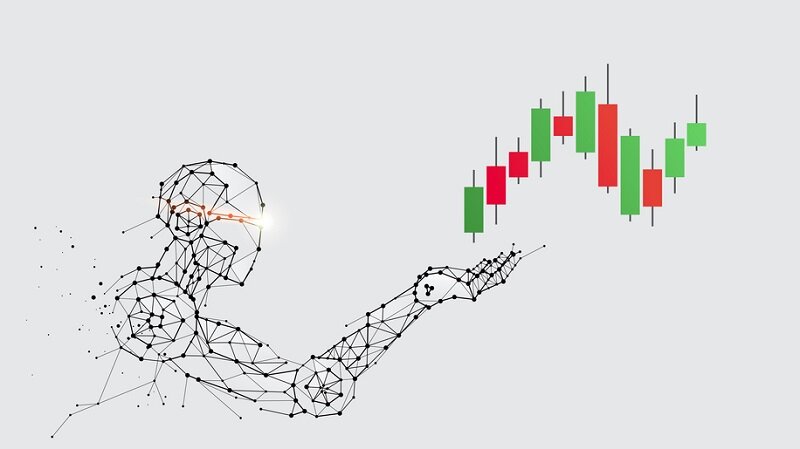
Forex Indicators: candlestick patterns;
Strategy: Medium-term;
Protective Orders: Stop-loss, TakeProfit.
Forex Trading Signals of the Strategy
1. Signal to Open a Long Position – formation of a bullish candlestick pattern (but not against a downtrend). Signal to close a long position – formation of a bearish reversal pattern.
2. Signal to Open a Short Position – formation of a bearish candlestick pattern (but not against an uptrend). Signal to close a short position – formation of a bullish reversal pattern.
3. If a bullish reversal pattern forms, but is blocked by a level above, we do not open a long position until it is broken through. Similarly, if a bearish reversal pattern forms, but is blocked by a support level below, we also do not open a short position until that level is broken through.
4. To open a long position against a downtrend, you can only use the following bullish patterns – gap in clouds, base tower, three inverted Buddhas.
5. To open a short position against an uptrend, you can only use the following bearish patterns – dark cloud cover, evening star, top tower, three Buddhas.
6. When opening a long position, the stop-loss order is placed 10 points below the bullish pattern.
7. When opening a short position, the stop-loss order is placed 10 points above the bearish pattern.
8. If a long position is open and a bearish reversal pattern appears on the chart, but the price movement downward may be blocked by a support level directly below it (or a support line), do not rush to close the position. It would be reasonable to move the stop-loss higher (just above this level or support line). Conversely, if a short position is open and a bullish reversal pattern appears on the chart, but the price movement upward may be blocked by a resistance level directly above it (or a resistance line), again do not rush to close the position. Simply move the stop-loss lower (place it above this level or resistance line).
Example of the Forex Strategy in Action

On January 15, a short was made using the “top tower” pattern (downward arrow on the chart). The stop-loss order was placed above this pattern (cross on the chart).
On February 2, after the formation of the “bullish harami” pattern with confirmation, the trade was closed with a profit of 400 points – checkmark on the chart. Do not buy, as the trend is downward. For this reason, it is advisable to avoid buying on March 2 when the hammer appears.

On March 18, a “falling star” pattern with confirmation appeared – a short was opened, which was closed on March 26 with a profit of 200 points due to the morning star. Do not buy here – the trend remains downward.
On May 4, a continuation pattern “three methods” formed – a short was opened. The stop-loss was placed 10 points above the high price of the previous candle in the pattern.
Subsequently, “black crows” – additional shorts occurred.
On May 19, a “bullish engulfing” pattern formed, followed by a tall white candle, then another candle with a white body. In theory, all shorts should have been closed, but there is a resistance level at 1.2625 above, which the price may not break through. Therefore, it is advisable to avoid closing the positions for now.
As expected, the price bounced off the resistance level downward. On June 10, a bullish reversal pattern “bullish engulfing” with confirmation formed. After breaking through the resistance level from below, it would be reasonable to close the short positions. The profit amounted to 1800 points. Do not buy, as the downtrend remains.

On June 22, a “bearish engulfing” pattern with confirmation formed. A short was opened. However, after a slight decline, the price moved sharply upward and triggered the stop-loss order with a loss of 200 points. At the same time, the conditions for an uptrend were met and a support line was drawn.
On July 13, a continuation pattern “holding on tatami” appeared – a long was opened.
On July 22, a “gap in clouds” pattern formed. At the same time, the price bounced off the trend acceleration line upward. An additional long was made.
On August 6, another “holding on tatami” pattern appeared – another additional long. The stop-loss is set 10 points below the low price of the previous candle in the pattern. The stop orders for previous longs are also moved here.
The candle from August 10 has a black body and a long lower shadow, which triggered the stop orders for previously opened longs with a total result of +450 points.
On August 17, a “bullish harami” pattern with confirmation appeared after bouncing off the support line – a long was opened. However, the trade turned out to be unsuccessful, the price fell, and the stop-loss order was triggered with a loss of 150 points.
On August 26, a “bullish engulfing” pattern with confirmation formed – a repeated long.
On September 14, a bullish pattern “three inverted Buddhas” formed – an additional long after the price broke through the horizontal line of the pattern from bottom to top.
On September 27, the last “bearish engulfing” pattern closed all longs with a total profit of 1200 points.

The “bearish engulfing” from October 11 did not receive confirmation.
On October 15, a “bearish harami” formed with a questionable confirmation by a candle with a long lower shadow. Selling is even more discouraged because the trend is upward.
The “bullish engulfing” from October 20 did not receive confirmation from the following white candle.
FAQ
What is the primary market and currency pair for this strategy?
The strategy is designed for the Forex market, specifically for the EUR/USD currency pair.
Which candlestick patterns are used to open long and short positions?
Long positions are opened using bullish patterns like gap in clouds, base tower, and three inverted Buddhas. Short positions are opened using bearish patterns like dark cloud cover, evening star, top tower, and three Buddhas.
How are stop-loss orders placed for long and short positions?
For long positions, the stop-loss is placed 10 points below the bullish pattern. For short positions, the stop-loss is placed 10 points above the bearish pattern.