


Gerald Appel developed the MACD in the 1970s, and it is one of the most popular indicators in use today. Traders use the MACD for determining trend direction, momentum and potential reversals. It is used to confirm trades based on other strategies, but it also provides its own trade signals.
Two lines compose the MACD: the MACD line and Signal line. These lines move together, except the MACD moves faster as the Signal line is a moving average of the MACD line.
The MACD Histogram that oscillates above and below zero shows the extent to which the MACD line is above or below signal line. The histogram provides a short-term view on recent momentum and direction. When the histogram is above zero, recent movement has been higher; below zero and the recent momentum was down. The greater the histogram value the greater the momentum of the recent move.
The MACD is calculated as follows:
MACD Line = EMA(12) – EMA(26)
Signal Line = EMA(9) of MACD Line
The MACD Histogram is the MACD Line – Signal Line
Here is a list of alternative indicators MACD.
FNCD
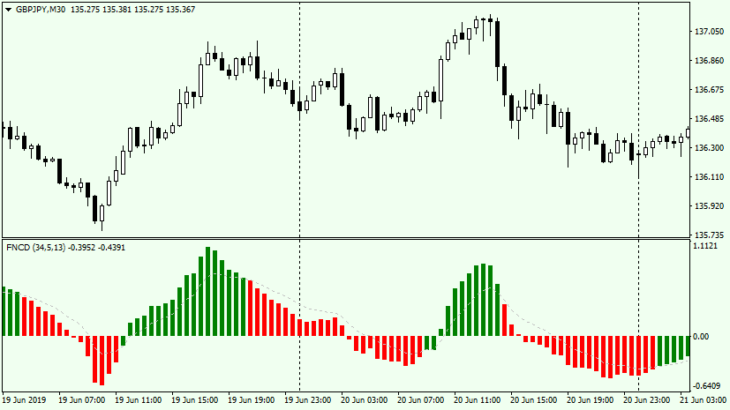
FNCD is an alternative to the MACD. Accordingly, trading with it is possible by a similar signal:
- crossing zero level
- change the color of bars
- divergence
Download
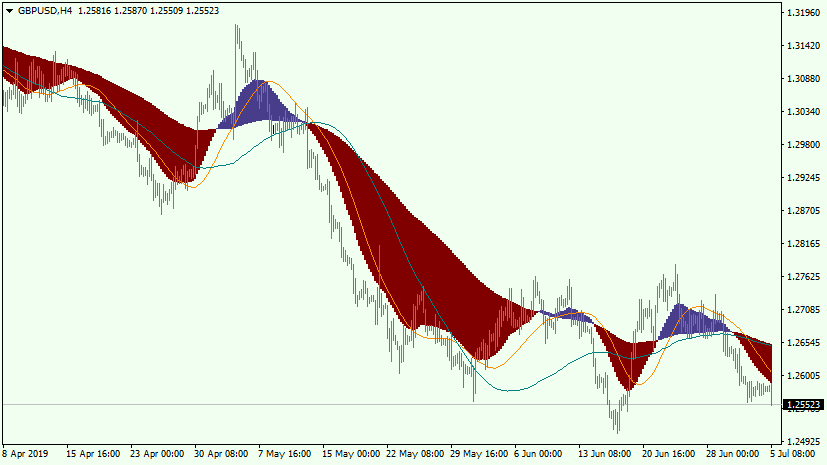
Visual MACD
MACD is one of the most popular indicators on the Forex. Visual MACD is another version displayed directly on the price chart. Trading is carried out in accordance with changes if bars’ colors. Closing the trade is made when moving average left the «cloud» area. You are free to choose your own trade tactic using this indicator and include it in your trade strategy.