


One major market index, the Russell 2000, has shown price behavior that is very worrisome. A decline of more than 1% from Tuesday’s close could be the first crack in the stock market dam that begins a wholesale stock market crash. When a major stock market index like the Russell 2000 is this close to falling apart, you need to be ready to head your portfolio by keeping an eye on the other stock market indices.
The stock market is at its third most expensive valuation history, as you can see from this chart. The yield curve keeps inverting, suggesting a recession might occur. Third-quarter corporate earnings have not been stellar. The federal government is starting to crack down on the most successful companies in the stock market. Manfacturing data is weak. All of this news, plus the trade war with China, adds up to a strikingly large possibility of a market meltdown. Rather than simply short-sell the entire stock market because things look bad in the aggregate, you can use the simplest forms of technical analysis to help you determine when to begin selling the market short.
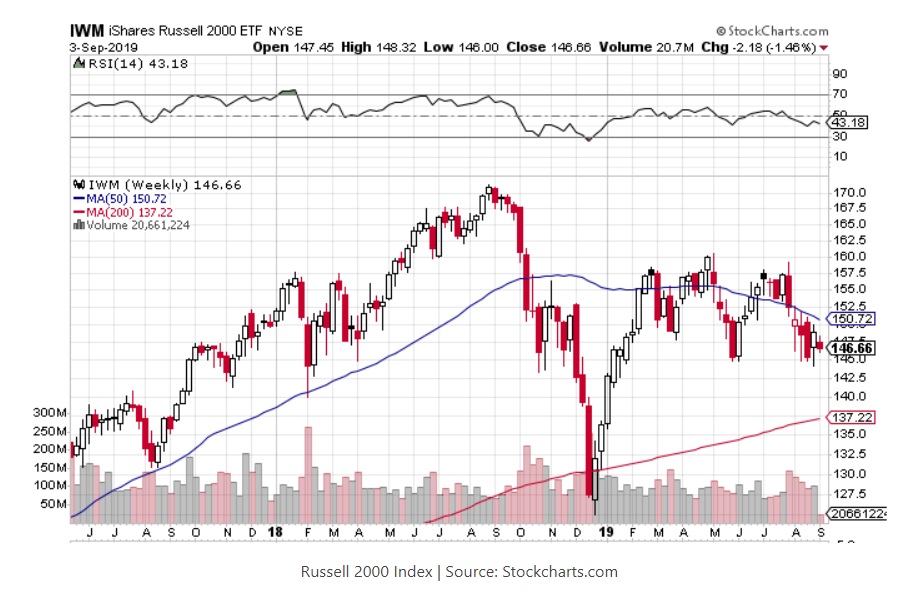
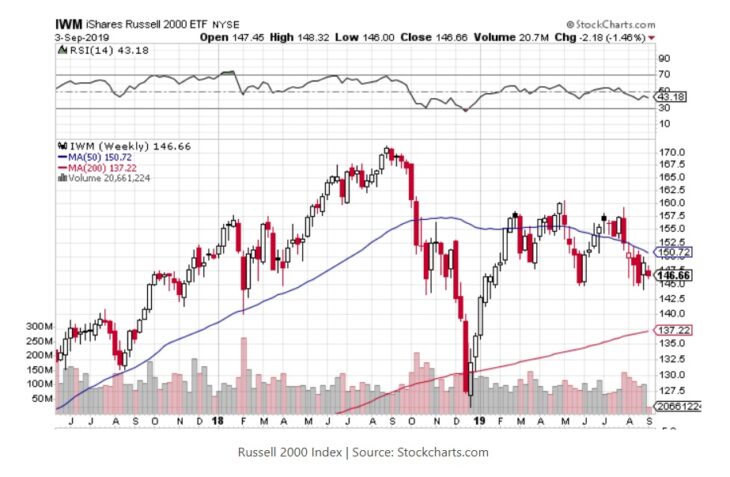
Right now, you want to be looking at three very simple trendlines on market indices that will tell you when to short the market. The first is called the 50-week moving average, which is simply an average of the closing price of the index over the last 50 weeks. The second trendline is the 200-week moving average, which is calculated the same way, but over 200 weeks.
Ed Butowsky, Managing Partner at Chapwood Capital Investment Management in Dallas, tells CCN: “The value of these trendlines, which appear or can be overlaid on almost every stock chart, is to show a kind of long-term sentiment on the respective index. Trendlines represent investor psychology. They show prices at which investors may step in and by if stock prices are declining.” However, if the price of an index falls below that trendline, and stays there for more than a day or two, it could signal major declines ahead. It means the buyers are not stepping up and may have lost faith in the market. That’s a good time to short an index. In the case of the Russell 2000 index, it is already fallen below the 50-week moving average. The iShares Russell 2000 ETF, a proxy for the index, closed Tuesday at $146.66. The 200-week moving average is at $137.22. A break below that could trigger the next selloff.