From the masterclass “Be a Trader with iLearney”
As many traders note, the simpler the strategy, the more logical its application, and the less subjective the identification of signals and reasons to reject them. Such strategies, free from doubt and essentially human bias, can be the most effective—whether operated by a robot or a human trader.
Fundamentals of a Trading Strategy
In this context, combining key elements of trading systems based on Ross hooks and the “Holy Grail” strategy by Linda Raschke and Larry Connors can allow you to build your own unique trading system.
Where is the simplicity if one strategy is complicated by another? Actually, simplification is achieved by omitting the filters described by the original authors. Let’s try to avoid using ADX and “trader’s tricks,” constructing a strategy based purely on the price chart and moving averages.
To begin, recall that a Ross hook refers to the failure of a bullish (or bearish) market to hold a new high (or low). In other words, it is an unsuccessful test followed by a pullback. Since these chart patterns require a trending market, it’s important to select the most effective entry point. A moving average can assist with this.
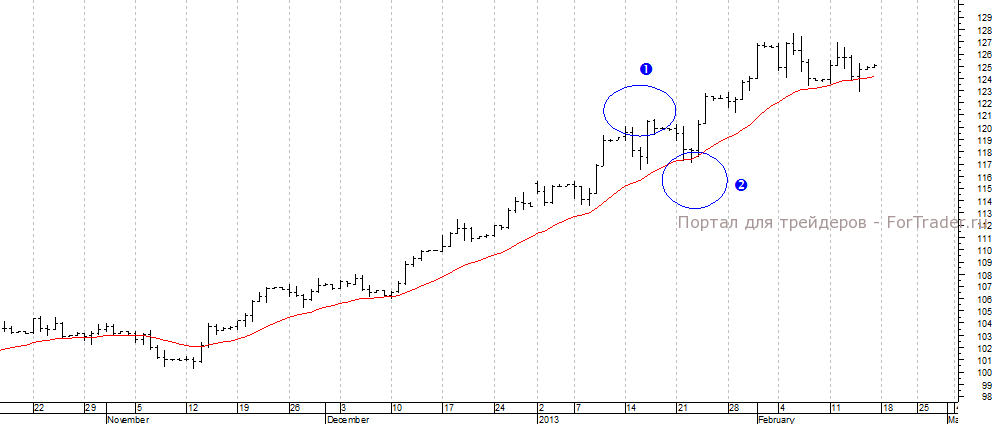
In mid-January of this year, amid a bullish trend, the EUR/JPY currency pair failed to stay above a previously formed high, resulting in a pullback (point 1 in Fig. 1). Using the EMA21 as dynamic support, you can find the optimal entry point when the test fails, confirmed by the closing price of the breakout bar. If this close is above the moving average, the trader has grounds to apply this strategy (point 2 in Fig. 1).
Additional Elements of the Trading Strategy
No trading system is complete without defining where to place the protective stop order and identifying the target level at which profits will be secured.
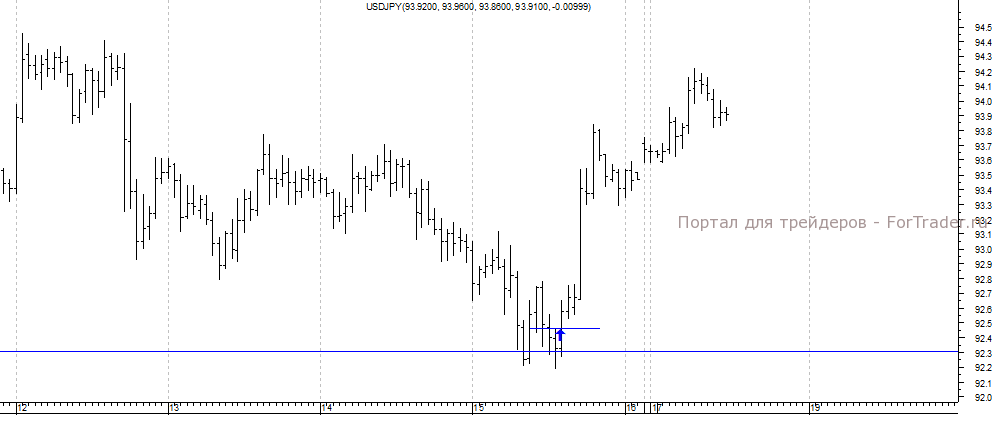
While risk limitation is fairly straightforward—stop loss is placed below the previously formed low around 92.2 yen per dollar for the relevant currency pair—take profit is more complex. Neither Linda Raschke and Larry Connors nor Joe Ross provide clear recommendations on this. Thus, profit targets can be set using profit factors, trailing stops, or even fundamental levels such as the Y100 level referenced by the Japanese government.
Regardless, a successful entry spares the trader many difficulties. The combined strategy also allows the use of a second screen to identify this.

Two-Screen Method for Opening Positions
First, on a smaller timeframe, mark a horizontal line corresponding to the EMA(21) level on the daily chart.
At the identified support area, pay attention to emerging chart patterns. Specifically, on hourly charts showing the USD/JPY pair’s movement, a pattern underlying the Anti-Turtles trading system appeared. By applying Victor Sperandeo’s 2B principle, the trader could optimally capitalize on the opportunity by opening a position from the high of the test bar of the previous market bottom (see Fig. 3).
Thus, by combining well-known strategies and adding your own elements, such as a second screen, a trader can develop a unique trading system characterized by moderate risk and high potential profitability.