From the masterclass “Be a Trader with iLearney”
As many traders note, the simpler the strategy, the more logical its application, and the less subjective the identification of signals and reasons to reject them. Such strategies, free from doubt and human bias, can be the most effective—whether operated by a robot or a human trader.
Ross Hook Trading Strategy Fundamentals
Combining key elements of Ross hooks with the “Holy Grail” strategy by Linda Raschke and Larry Connors lets you build a unique trading system.
Simplification comes from skipping the original authors’ filters like ADX and trader tricks. This approach relies purely on price action and moving averages.
A Ross hook occurs when a bullish (or bearish) market fails to hold a new high (or low)—an unsuccessful test followed by a pullback. These patterns need a trending market, so use a moving average to pinpoint the best entry.
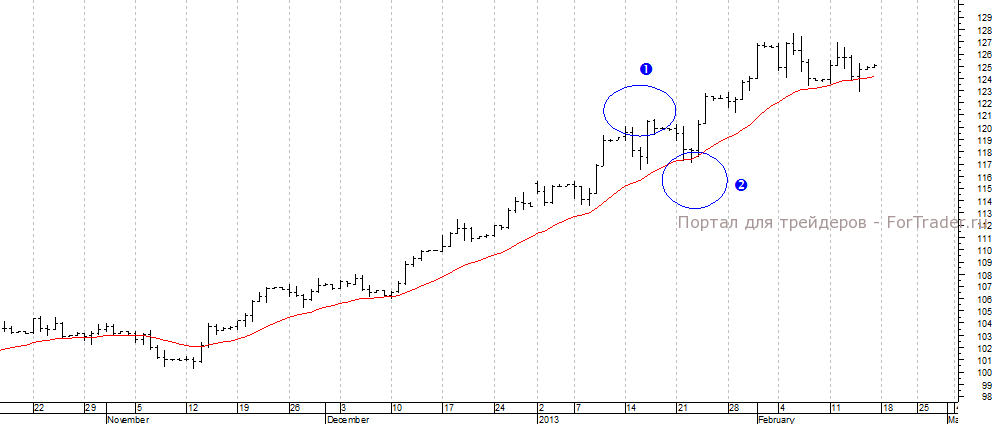
Fig. 1. Using moving average to select entry point.
In mid-January this year, during a bullish trend, EUR/JPY failed to hold above a prior high, triggering a pullback (point 1 in Fig. 1). The EMA21 acts as dynamic support for the optimal entry point on hook failure, confirmed by the breakout bar’s close above the moving average (point 2 in Fig. 1).
Stop Loss and Take Profit Rules
Every system needs clear rules for protective stop loss and profit targets.
Place stop loss below the prior low, around 92.2 yen for this pair. Take profit requires more thought—original sources from Raschke, Connors, and Joe Ross lack specifics. Use profit factors, trailing stops, or key levels like Y100.
A solid entry reduces issues. The combined strategy supports a second screen for confirmation.

Fig. 2. Defining stop loss and take profit levels.
Two-Screen Entry Method
On the smaller timeframe, draw a horizontal line at the daily EMA(21) level.
Watch for patterns at support. On USD/JPY hourly charts, an Anti-Turtles pattern emerged based on Victor Sperandeo’s 2B principle. Enter from the high of the test bar at the prior bottom (Fig. 3).
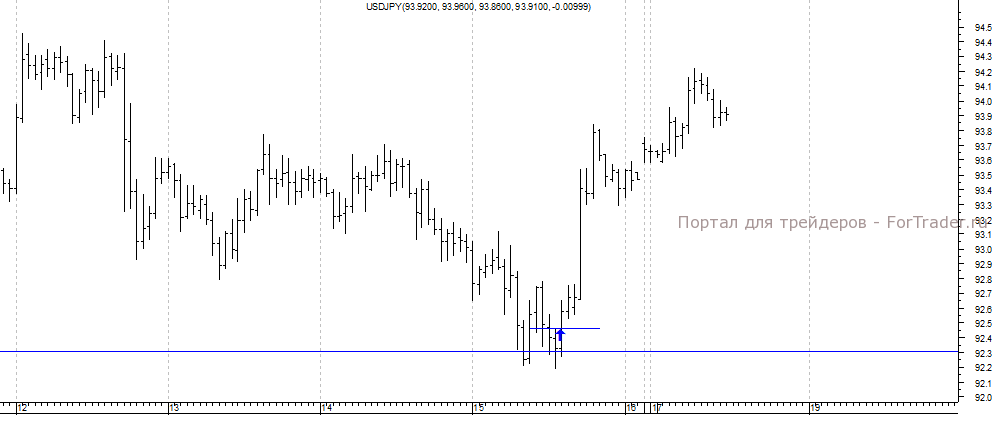
Fig. 3. Determining the entry point.
Combining proven strategies with elements like a second screen creates a unique system with moderate risk and high profit potential.
FAQ
What is a Ross Hook pattern?
A Ross Hook is a failed test of a new high or low in a trend, followed by a pullback, signaling reversal potential.
How do you set entry with moving averages?
Enter on hook failure when price closes above/below EMA21 in the trend direction, using it as dynamic support/resistance.
Where to place stop loss and take profit?
Stop loss below prior low/high; take profit via trailing stops, profit factors, or key levels like round numbers.