Using graphic models on Forex in their pure form may seem like a risky activity at first glance, so traders set up a system of filters that allow them to identify more reliable models. These filters include time and correctional dependencies as well as individual indicators. For example, a trader makes a decision to open a trade only if the reversal pattern ‘Three Indicators’ occurs along with a divergence on MACD. However, such a system can no longer be classified as Price Action methods, which imply trading without indicators.
Parent and Child Patterns
As an alternative to using calculation indicators as filters, the interaction of models can be used. Many of them have a wave structure, so they can be divided into parent and child patterns.
 Graphic pattern ‘Three Indicators’
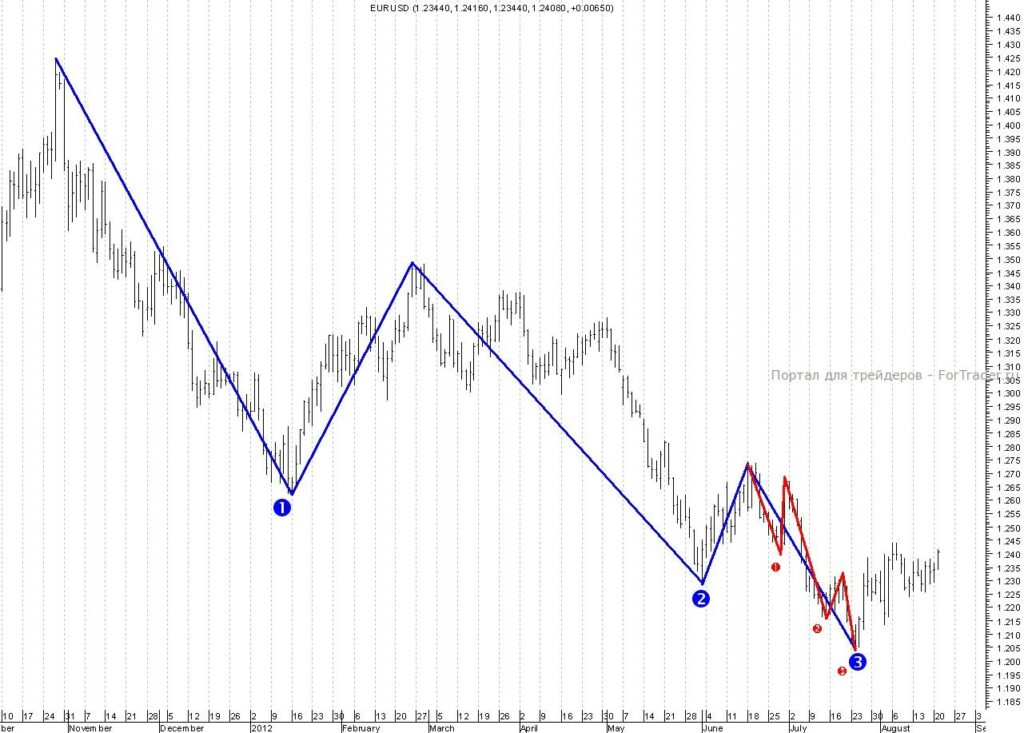
On the daily chart of the EUR/USD currency pair, it is clearly visible how the graphic pattern ‘Three Indicators’, marked in red, forms. It can be considered a child structure, which is part of the parent pattern drawn in blue. In this case, if the principles of harmonic trading allow identifying the same targets for the downward movement in both graphic configurations, their interaction helps identify a relatively reliable entry point. In the example provided, the reversal of the bearish trend occurred from the area of 161.8% of the last corrective waves of both patterns.
Interaction of Graphic Models
The use of models does not end here. The reliability of the trading system can be increased by applying trading strategies based on the ‘1-2-3’ pattern, which forms immediately after the ‘Three Indicators’.
 Graphic pattern ‘1-2-3’
As seen from the figure, after the reversal of the bearish trend based on three consecutive declining lows, bears tried to take initiative, forming point 3 marked in blue. However, their strength was insufficient to restore the losing momentum downward movement. As a result, the market finally reversed.
A classic way to open a position based on the ‘1-2-3’ model is to place a buy order at the level of the corrective high (point 2). However, for a more risk-taking trader, an interesting opportunity for entry will be the impulse occurring around the last low of the chart, which is usually formed at the level of 50-78.6% from wave 1-2. This strategy may involve opening a buy position when prices fall into the 61.8-78.6% range, followed by a return to the 50-61.8% levels. A protective stop order is placed just below the absolute low.
Complex Graphic Patterns
An experienced trader will immediately recognize the ‘Three Indicators’ and ‘1-2-3’ models as a more well-known trend reversal figure ‘Head and Shoulders’. And he would certainly be right, but identifying the components of the pattern allows for a deeper analysis and determining an earlier entry point. At the same time, the sequential formation of each component allows predicting further price behavior. Thus, a trader can forecast the formation of the second shoulder (the ‘1-2-3’ model) immediately after the price’s reverse movement from the corrective high area. If the market moves below the head level, the pattern is considered unformed.
It should be noted that not only the ‘Three Indicators’ graphic pattern, but also the ‘1-2-3’ model has embedded (child) configurations, which we will discuss in our subsequent conversations. Understanding the mechanism of their formation by breaking down more complex patterns into simpler ones allows a deeper understanding of the market pricing process. As a result, there is no need to use auxiliary tools such as divergences or other signals provided by indicators.
Other articles on the use of graphic patterns
- Identifying a trend reversal using graphic patterns
- Expanding formation – a pattern that teaches not to relax
- Technical reversal trend figures – price patterns ‘Bull Day’
FAQ
What are the ‘Three Indicators’ and ‘1-2-3’ patterns?
The ‘Three Indicators’ and ‘1-2-3’ are graphic patterns used in forex trading to identify potential trend reversals and entry points.
How do these patterns interact?
These patterns interact by forming a sequence where the ‘1-2-3’ pattern often follows the ‘Three Indicators’ pattern, providing confirmation and a more reliable entry point for traders.
Can these patterns be used without indicators?
Yes, these patterns can be used without technical indicators, relying solely on price action and their structural relationships to make trading decisions.