Masterclass: Trading Strategies in Practice – Strategy 7
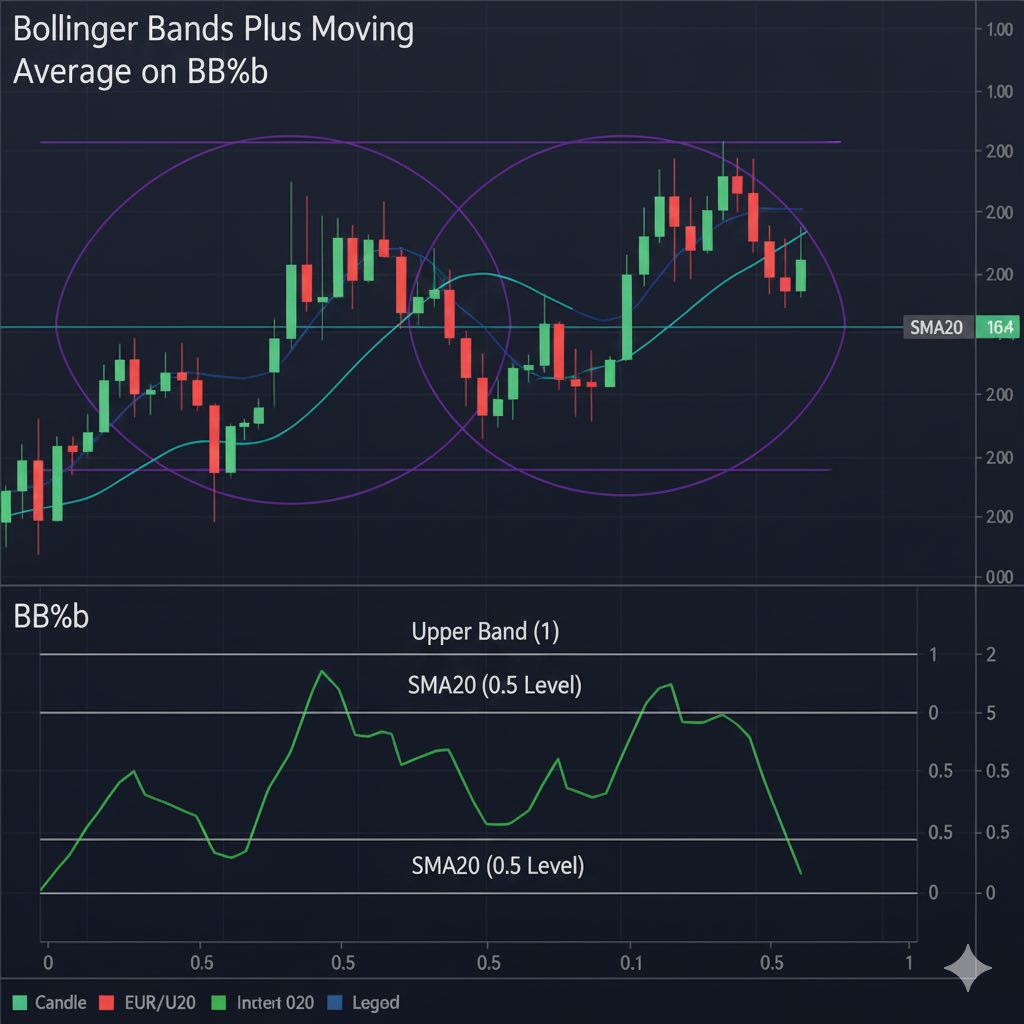
The Bollinger Bands %b trading strategy uses Bollinger Bands and the %b indicator, which normalizes price position within the bands as levels 0, 0.5, and 1. BB%b shows price relative to the bands below the chart, with the SMA20 middle band at 0.5, upper band at 1, and lower at 0.
In trending markets, price movement stretches the SMA20 in the %b window, with price oscillating around 0.5. Price crossing beyond the bands corresponds to %b crossing 1 or 0.
Buy Signal Setup
Confirm the main filter: EMA89 must rise for buys. The SMA20 (Bollinger middle band) must trend up. The 30-period smoothed moving average on BB%b must rise above 0.5 (blue line).
In an uptrend, enter at pullbacks to lows, ideally below SMA20 or touching the lower Bollinger Band. BB%b confirms when it drops below 0.5 or 0, forming a low that ends correction and starts impulse.

Fig. 1. Pullbacks in an uptrend.
Mirror for downtrend.

Fig. 2. Pullbacks in a downtrend.
All three trend filters must align. Bullish: rising EMA89, rising SMA20, Smoothed MA30 on BB%b above 0.5 and rising. Bearish: opposite.
Strategy advantages: Enters at correction peaks into impulse waves, reducing time in drawdown.
Strategy risks: May catch only B-wave of correction. Avoid if MA30 on BB%b crosses 0.5 against trend, signaling correction or reversal.

Fig. 3. Correction and the role of MA30.
FAQ
What is BB%b in Bollinger Bands?
BB%b normalizes price position within Bollinger Bands: 0 at lower band, 0.5 at SMA20 middle, 1 at upper band.
How do buy signals work?
Rising EMA89, rising SMA20, MA30 on BB%b above 0.5 and rising; enter on pullback when BB%b dips below 0.5.
What are the main risks?
Entries may catch B-wave corrections; avoid if MA30 on BB%b crosses 0.5 against the trend direction.