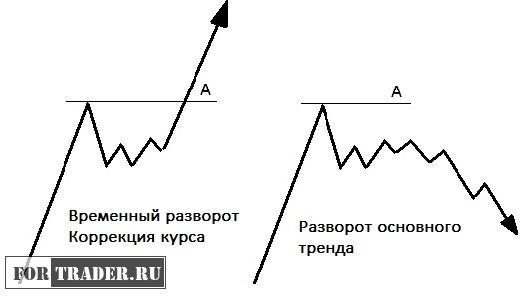
A trend reversal, also known as a market correction or pullback, refers to a temporary shift in an established trading trend. This typically occurs during periods of overbought or oversold conditions when traders and investors decide to lock in profits due to a significant drop in the initial momentum.
Such a temporary reversal or corrective movement usually constitutes half or a third of the main price movement. After this phase, the primary trend often regains strength, retests the pullback, and continues with increased momentum, offering traders the opportunity to capture substantial profits by catching the movement.
How to Trade During Trend Reversals and Corrections
Trading during a trend reversal can be risky and may lead to significant losses. As the saying goes, ‘The trend is your friend.’ A corrective movement can be interrupted at any time since it is primarily driven by profit-taking. If traders believe the main trend is still intact, they may re-enter the market in the original direction, seeking greater profits at more favorable levels.
How to Identify Trend Reversals and Corrections
There are numerous indicators that can signal a trend reversal. Simple oscillators available in most trading platforms, such as Stochastic or MACD, often indicate overbought and oversold market conditions. Identifying these movements is easier than you might think.
During a trend reversal, an indicator typically breaks out of its previous range confidently. If it quickly reaches the opposite level, it suggests a temporary reversal. However, if the movement persists, the trend may be changing direction. If a corrective move is supported by the market and lasts longer, it could signal a full trend change. Successful trading using oscillators requires careful observation of their signals and some experience.
Traders often use candlestick patterns or price action analysis to identify trend reversals.
FAQ
What is a trend reversal?
A trend reversal is a temporary shift in an established market trend, often occurring during overbought or oversold conditions.
How can I identify a trend reversal?
Trend reversals can be identified using technical indicators like Stochastic or MACD, which show overbought and oversold conditions. Candlestick patterns and price action analysis are also commonly used.
Is trading during a trend reversal risky?
Yes, trading during a trend reversal can be risky. It’s important to carefully monitor market conditions and use proper risk management strategies to minimize potential losses.