


- Types of Trends
- Trend Phases
- Trend Strength
- Drawing Trend Lines
- Challenges of Trend Trading
- Trading Trend Lines Correctly
- Trend Indicators
- Pros and Cons of Trend Strategies
Types of Trends
Trend lines connect key price points to reveal market direction and help traders align with buyers or sellers in control. There are three main types of trends:

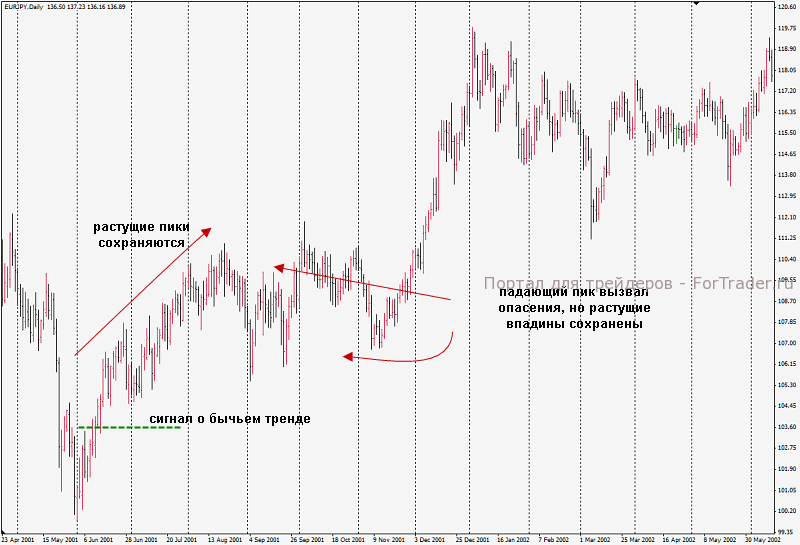

- Uptrend (bullish trend), showing rising prices over time. On charts, it appears as a series of higher lows.
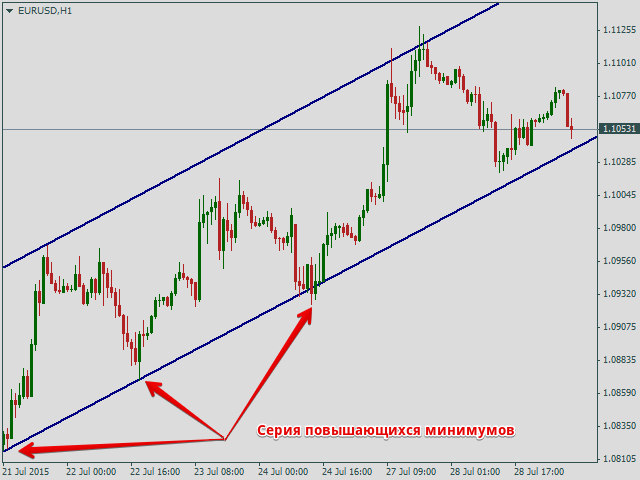
Fig. 1. Uptrend, EUR/USD currency pair
- Downtrend (bearish trend), indicating falling prices; on charts, it shows a series of lower highs.
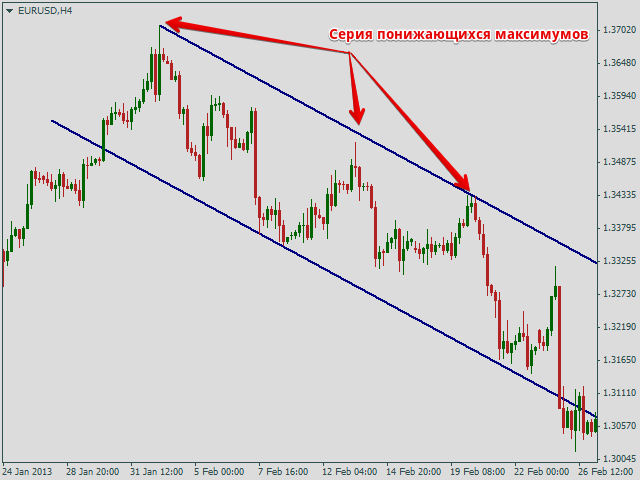
Fig. 2. Downtrend, EUR/USD currency pair
- Flat (sideways trend, range, neutral consolidation), reflecting minor price fluctuations in a narrow range. On charts, it shows highs and lows at the same level.
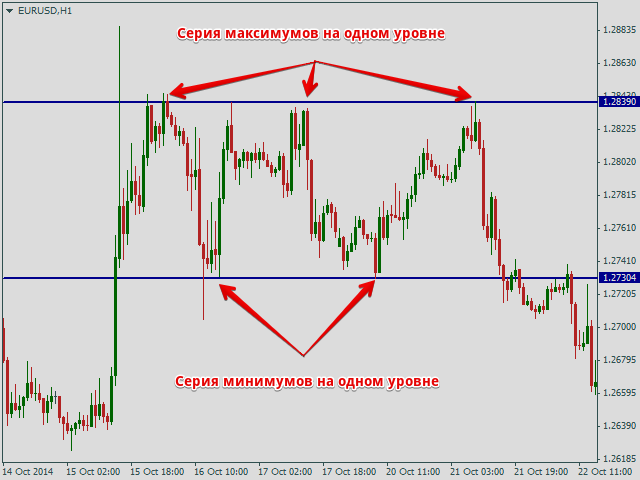
Fig. 3. Flat, EUR/USD currency pair
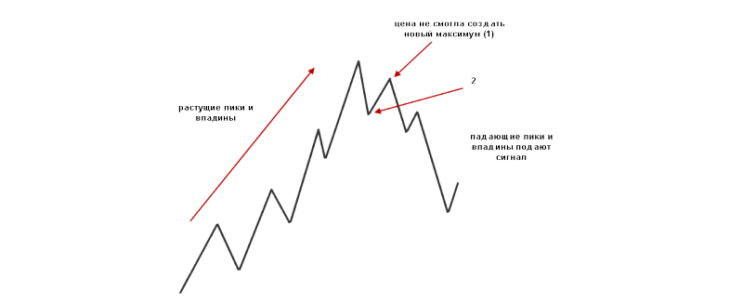
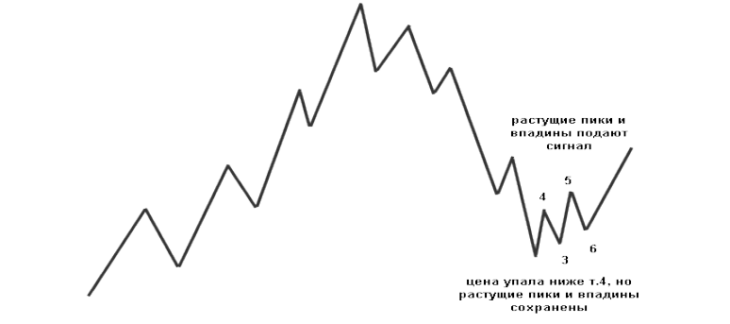
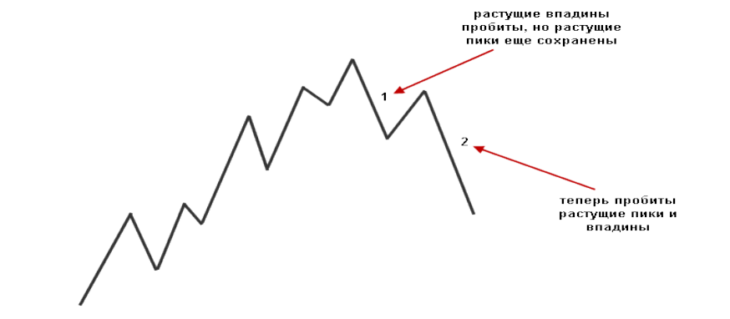
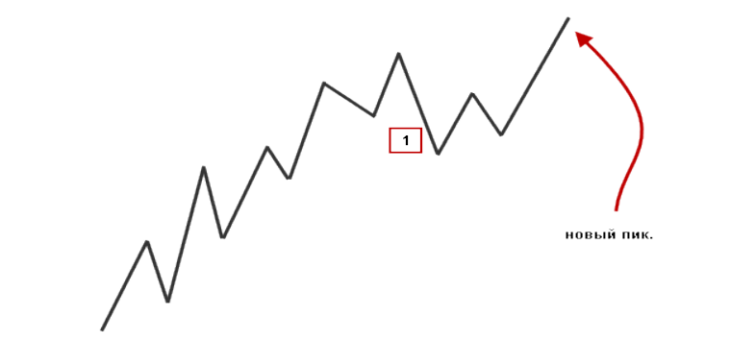
Trend Phases
Every price trend consists of several phases:
- 1. Trend start.
- 2. Trend phase.
- 3. Correction phase.
- 4. Trend end (reversal).
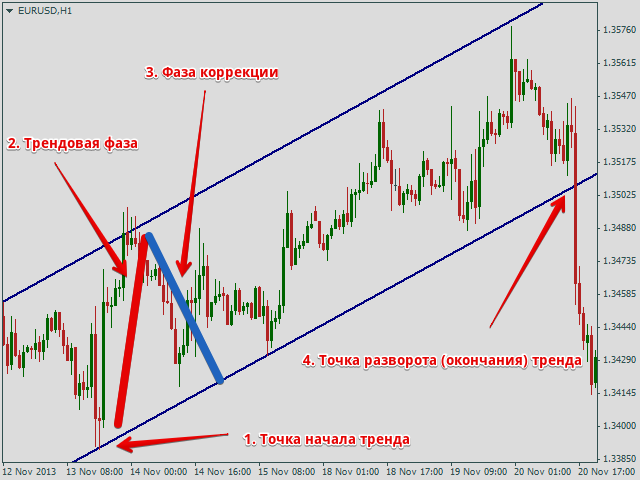
Fig. 4. Trend phases
Traders aim to enter at the trend’s start and hold until reversal for maximum profit. Closing at trend breaks is key, but false breakouts and strong corrections often mislead on live charts.
Trend Strength
A trend is the schematic direction of price dynamics. Understanding and drawing them correctly is essential for any trader. Trends help:
- Build standalone trading strategies.
- Grasp Dow Theory principles.
- Apply technical indicators effectively.
Drawing Trend Lines
In technical analysis, trends link to support and resistance levels. All trend types form price channels bounded by trend lines.
Rule for Uptrends
Draw the support line through successively higher lows. Copy it parallel to highs as resistance.
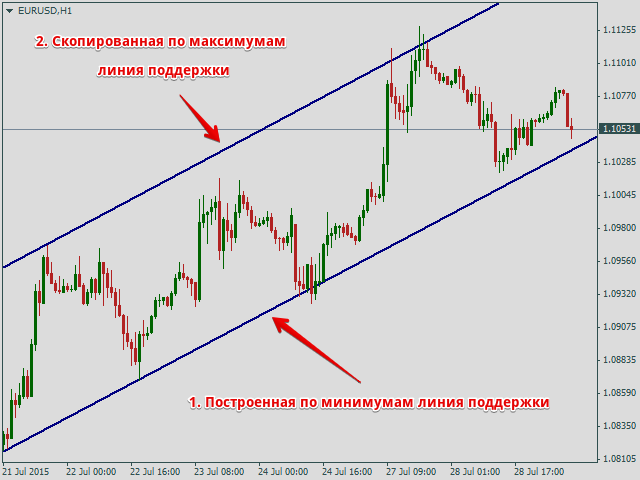
Fig. 5. Drawing an uptrend
Rule for Downtrends
Draw the resistance line through successively lower highs. Copy it parallel to lows as support.
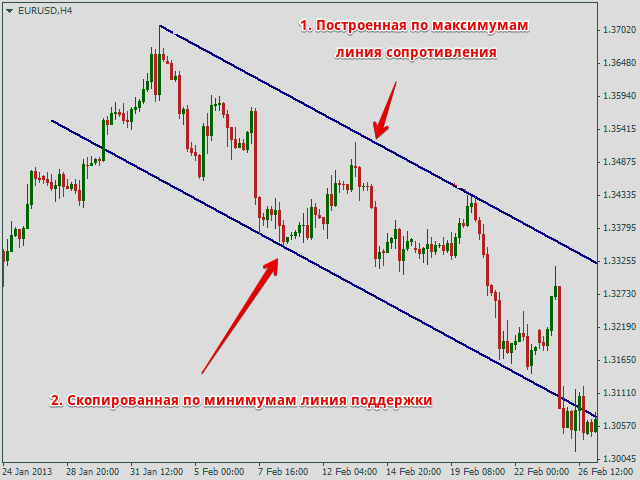
Fig. 6. Drawing a downtrend
Rule for Flat
Draw horizontal support and resistance through lows and highs.
Rule of Number N
Uptrends use lows, downtrends use highs. Use a time filter for significant extremes, confirmed by a time lag before and after, called number N.
For N=2, build uptrends only on lows with no higher lows N bars before or after.

Fig. 7. Example of using number N for trend lines.
Challenges of Trend Trading
Identifying trends is easy, but following them is hard due to psychological biases and fears:
- Trend systems seem too simple to work.
- Hard to measure statistically.
- Uncertain entry/exit timing.
- Difficult stop-loss placement.
- Requires constant chart monitoring.
- Beginners struggle to draw trends quickly on short timeframes.
Practice solves some issues. Use Excel or terminal tools to backtest trend strategy effectiveness.
Trading Trend Lines Correctly
Classic Strategy
Open positions on bounces from trend lines, close at the opposite line. Uptrends: buy only. Downtrends: sell only. Flat: buy or sell.
- Uptrend: Buy on support bounce, close near resistance.
- Downtrend: Sell on resistance bounce, close near support.
- Flat: Buy on support bounce to resistance; sell oppositely.
Classic Strategy Example
Norilsk Nickel daily chart shows clear trends despite larger-scale noise.
FAQ
What are the three main types of trends in Forex trading?
Uptrend with higher lows, downtrend with lower highs, and flat trend with highs and lows at similar levels.
How do you draw a trend line for an uptrend?
Connect successive higher lows to form the support line, then draw a parallel resistance line through highs.
What is the Rule of Number N for trend lines?
Use a time filter where lows or highs have no higher/lower points for N bars before or after to confirm significant extremes.


