
Trend (Eng. trend — tendency) – in financial markets, this is the direction of price movement of a selected instrument: rising or falling asset price.


- Types of Trends
- Trend Phases
- Trend Strength
- Drawing Trend Lines
- Rule of Number N
- Challenges of Trend Trading
- Trading Trend Lines Correctly
- Classical Strategy
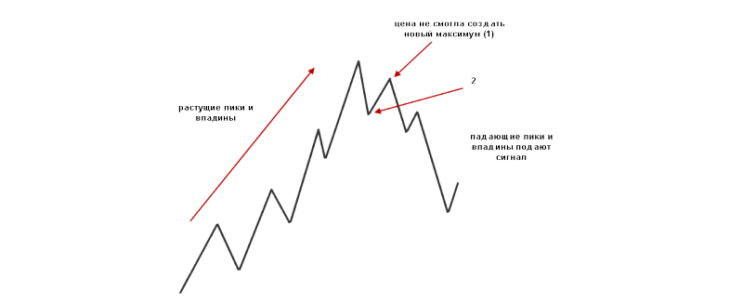
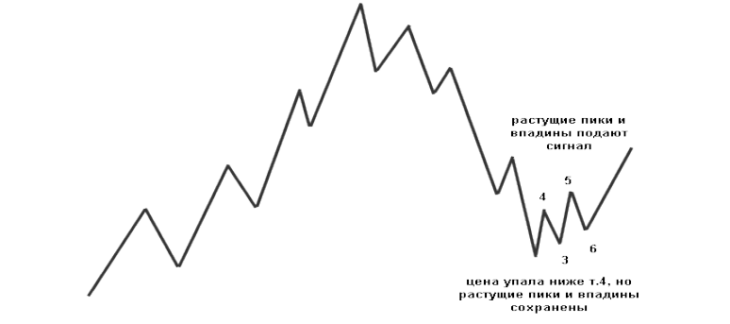
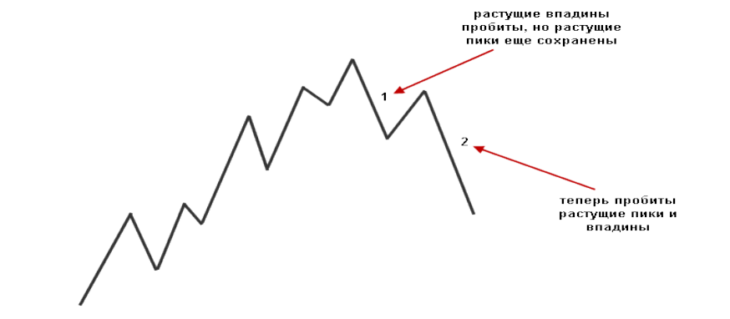
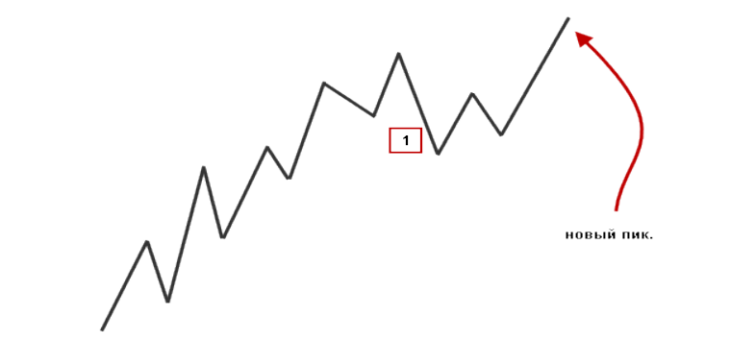
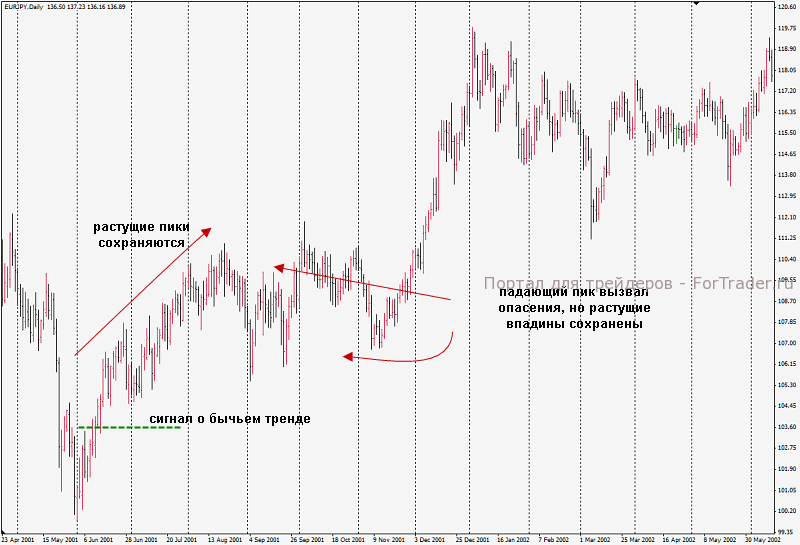
- Dow Theory Method for Trend Identification by Peaks and Troughs
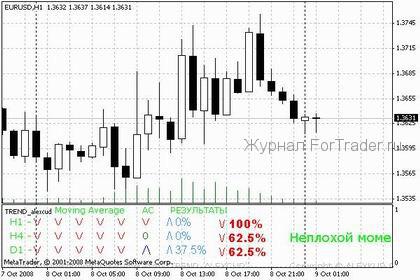
- Trend Indicators
- Advantages and Disadvantages of Trend Strategies
Types of Trends
There are three main types of trends:
- uptrend (bullish trend, up-trend), which shows price growth over a certain period. On the chart, this appears as a series of price lows, each higher than the previous one.
n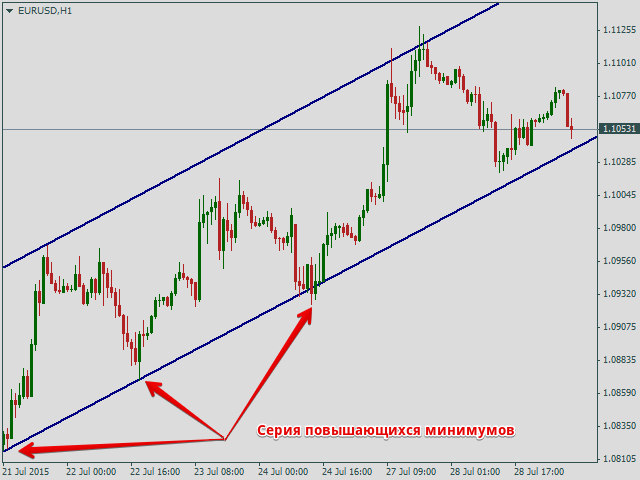
- downtrend (bearish trend, down-trend), which indicates falling prices; on the chart, this appears as a series of successively lower price highs;
n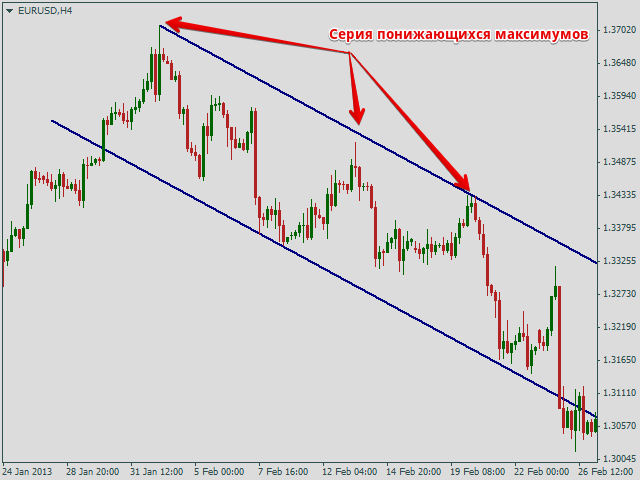
- flat (sideways trend, range, neutral consolidation), which reflects minor price fluctuations within a narrow range. On the chart, this appears as a series of highs and lows at the same level.
n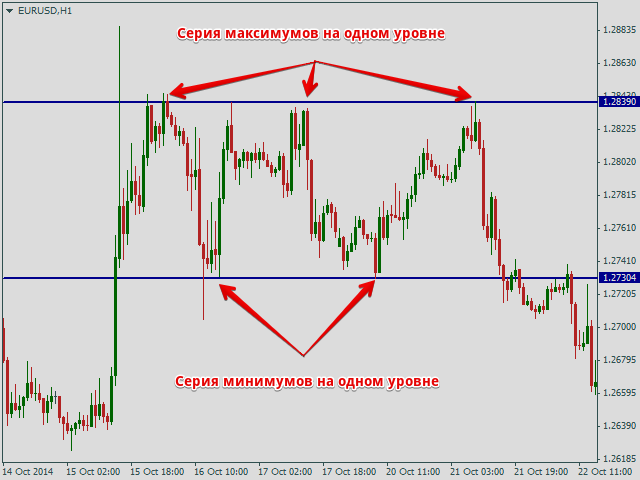
What Phases Make Up a Trend?
Every price trend consists of several phases:
- 1. Trend start.
- 2. Trend phase.
- 3. Correction phase.
- 4. Trend end (reversal).
n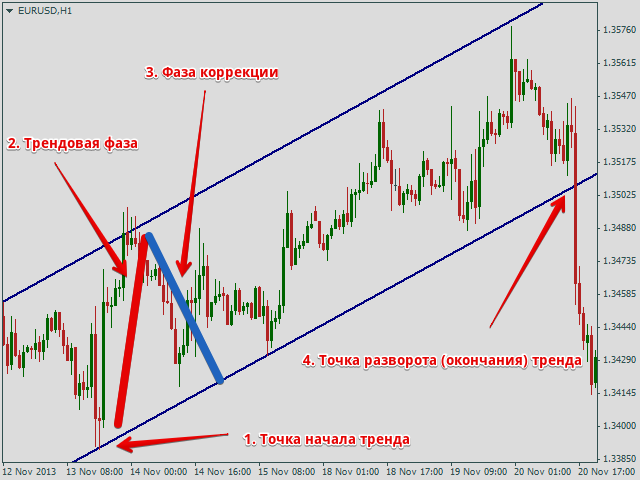
Traders always aim to catch the trend start and hold the trade until price reversal, maximizing profit. It’s crucial to close the trade at the trend breakout. However, this is challenging on real charts due to false breakouts and strong corrections that can mislead about the true market sentiment.
Trend Strength
Trend is the schematic direction of price dynamics. Understanding and correctly drawing them is a vital skill for any trader. Trends help:
- create independent trading strategies;
- better understand theories from Charles Dow’s teachings;
- more effectively apply exchange technical indicators.
Drawing Trend Lines
In technical analysis, the trend concept is inseparable from support and resistance levels. All trend types appear on currency pair charts as price channels bounded by technical lines called trend lines.
Rule for Uptrend
An uptrend is drawn by connecting successively higher lows or troughs to form a support line. This line is then copied parallel to the price highs or peaks to serve as the resistance line.
n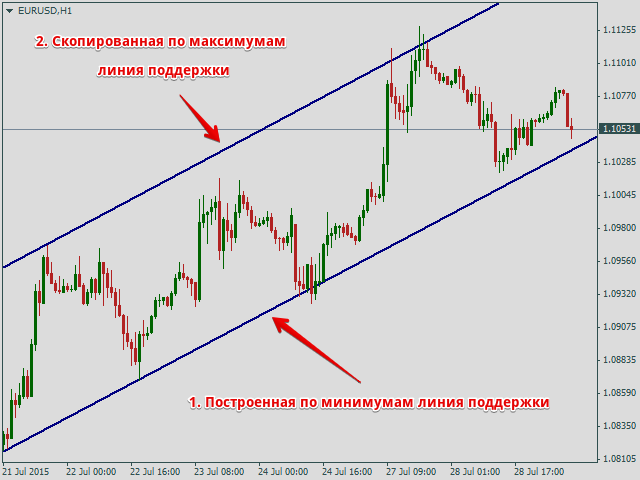
Rule for Downtrend
A downtrend is drawn by connecting successively lower highs or peaks to form a resistance line. This line is then copied parallel to the price lows or troughs to serve as the support line.
n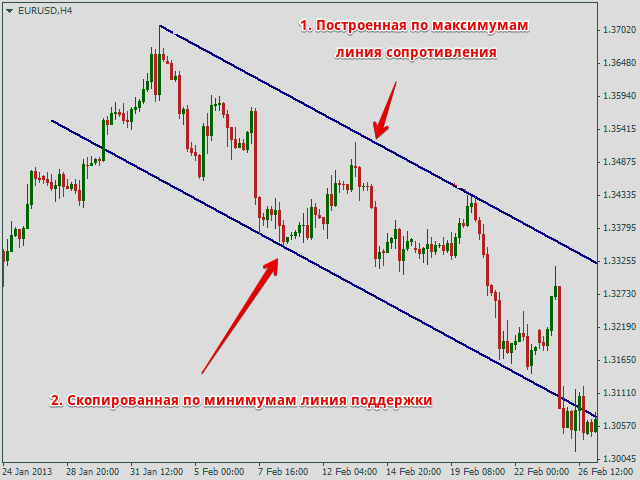
Rule for Flat
Flat is drawn using horizontal or nearly horizontal support and resistance levels through lows and highs respectively.
Rule of Number N
Uptrends are drawn by troughs, downtrends by peaks. To identify significant extremes, apply a time filter and draw trends only through peaks or troughs confirmed by a specific time lag before and after formation. This filter is often called the number N in literature.
For example, set N=2. This means an uptrend can only be drawn through peaks with no higher peaks N intervals before or after. The second trend drawing option on the chart does not qualify.
n
Challenges of Trend Trading
It’s hard to misidentify a trend, but following it is difficult for many traders due to psychological reasons. Traders face these prejudices and fears:
- trend systems seem too simple and thus ineffective;
- trend effectiveness is hard to calculate statistically;
- entry/exit timing is unpredictable;
- measuring stop-losses (loss limiters) is difficult;
- constant chart monitoring is required;
- on small timeframes, beginners struggle to draw trends for timely entries.
Some issues resolve with practice, but others can be addressed now using a calculator, Excel, or the ruler tool in trading platforms to calculate trend strategy effectiveness.
Trading Trend Lines Correctly
Classical Approach
Trend trading involves opening positions on bounces from trend lines and closing at the opposite trend line. Classical trend trading means: buys only in uptrends, sells only in downtrends. Flat allows both buys and sells.