In this article, we explore a specific long-term investment model for financial markets (1 year and more) using a combined portfolio.
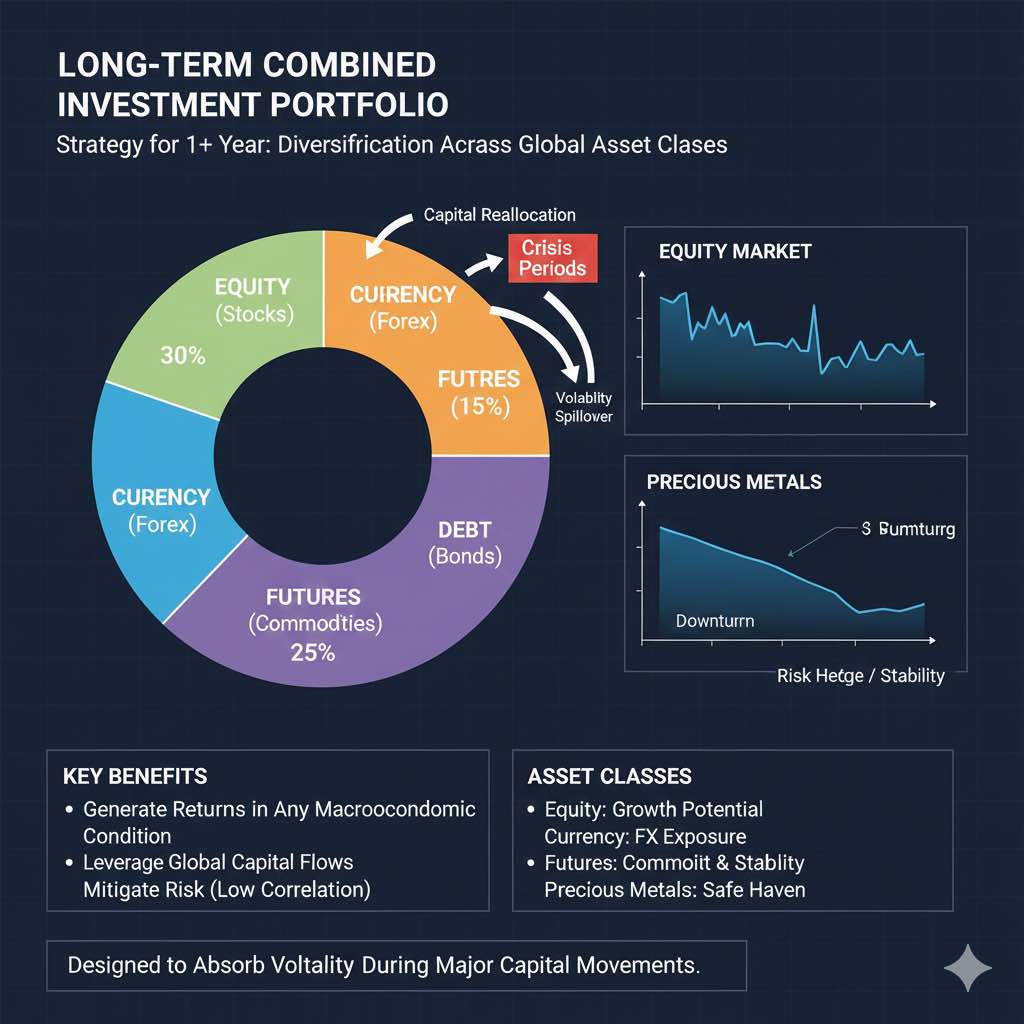
Mixed (combined) portfolios are built on assets from various segments of the global market: equity, currency, futures, debt, and others. Since large investors aim to generate returns under any macroeconomic conditions, a downturn in one segment (such as equity markets during crisis periods) is highly likely to lead to capital reallocation and volatility in another segment of the global market, for example, the precious metals market. The latter can serve as a low-yield but reliable risk hedging sector. Thus, a combined investment portfolio allows you to leverage global capital flows under any macroeconomic scenario, as it includes assets from all the most liquid markets.
The considered instrument absorbs a large portion of available volatility during major capital movements.
Composition of Our Combined Investment Portfolio
The investment portfolio position “Two Trends” (DT) is based on the quotation of a currency-equity portfolio (VF) VF=(RIO+AUD+DJI+DE30) in units of commodity instruments: gold and petro-currencies, i.e., currencies with high correlation to the crude oil market. The base portfolio is constructed from:
- shares of mining company Rio Tinto Group (RIO), traded on the London Stock Exchange,
- Dow Jones Industrial Average (DJI),
- German stock index DAX (DE30),
- Australian dollar (AUD).
Quotation is based on a cross-rate model – buying DT equates to buying the currency-equity portfolio and selling the “commodity” portfolio (CP) CP=(XAU+XAG)+(CAD+NOK).
The first part of the quoted CP portfolio is based on gold and silver traded on the spot market. Correlation between the last two currencies, CAD and NOK, and the Brent crude oil futures contract over the past year was 91% and 96%, respectively. For this reason, the second part of the quoted portfolio can serve as a currency equivalent of the Brent futures contract. As shown below, the combined portfolio is constructed from two quotations:
- Equity portfolio DJI+DAX(DE30) versus petro-currencies CAD, NOK;
- Assets correlated with gold, RIO, AUD versus the portfolio of precious metals GOLD(XAU)+SILVER(XAG). Note that in the “gold” instruments portfolio, we included shares of mining company Rio Tinto Group and the Australian dollar.
Thus, investing in the combined portfolio results in opening a set of positions to buy/sell assets:
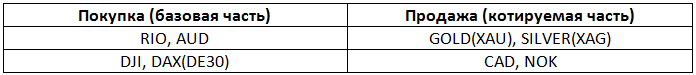
The portfolio’s return is determined by the returns of two groups of positions: the base “long” position and the quoted “short” position – and depends on their ratio, i.e., the spread. For this reason, the proposed instrument is called a portfolio spread and stands out favorably from classic investment portfolios due to its high degree of market neutrality. This allows maintaining high stability of the position portfolio during periods of global financial instability, as will be demonstrated below.
Investment Structure of the Portfolio
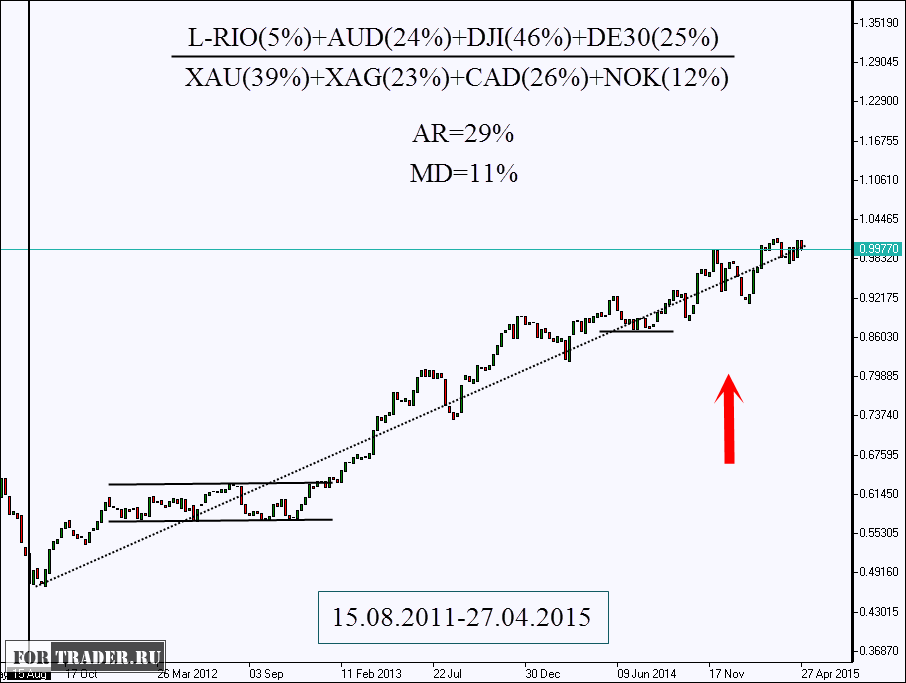
To optimize the portfolio spread, a historical interval from August 15, 2011, to April 27, 2015, was used, with weekly closing prices. This four-year period characterizes the trend of recovery in developed economies after the acute phase of the 2008 global financial crisis ended. The portfolio price chart was built using the NetTradeX trading platform and the built-in GeWorko model interface – see the figure below.
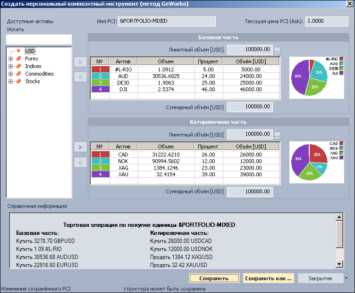
The volumes of the base and quoted parts are equal, similar to the volumes of buying/selling a currency cross-rate. To determine the weights, the standard portfolio theory of capital asset pricing (CAPM model) was used. Details of the calculation procedure are beyond the scope of this article.
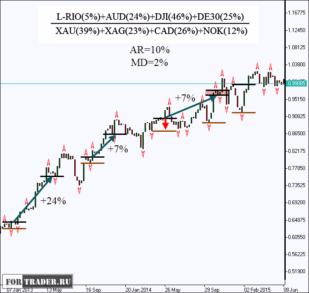
The shares of assets in the base portfolio are distributed as follows: RIO(5%), AUD(24%), DAX(25%), DJI(46%). The total weights of the base part sum up to 100%. The quoted portfolio: CAD(26%), NOK(12%), XAG(23%), XAU(39%). The absolute (limit) USD volume can be chosen based on deposit capabilities. The distribution of absolute shares is performed automatically in the program. After creating the instrument within the GeWorko interface, it can be added to the instrument library for standard operations and charting.
Instrument Return – 116%
The period from January 30, 2012, to December 10, 2013, is the least attractive for investments. On the price chart, this period is represented as a horizontal corridor. During this period, the instrument showed zero return but did not exceed a drawdown of 11% from invested funds. What was happening in the markets during this period?
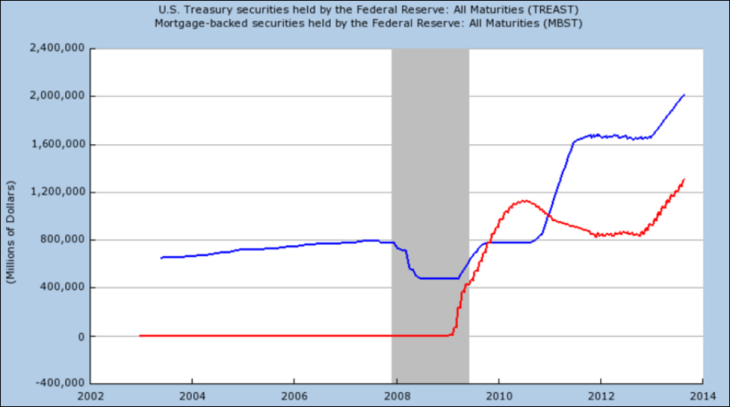
In 2012, the penultimate stage of US quantitative easing (QE) ended (see the figure below). The Fed reduced its monthly bond purchases by 20%, significantly decreasing trading volumes in the debt and currency markets. Global stock indices reacted with temporary stagnation, as the US economy was the main driver of post-crisis recovery.
In 2011, after the formation of the second crisis phase, global unemployment reached record levels – over 6%. The increase in unemployment in 2013 was 5 million people. This phenomenon was also the result of the strict austerity policies pursued by governments of several countries. As a result, from 2011, global GDP growth fell from 10.7% to 2.7% in 2013, i.e., almost fourfold. During the same period, the oil market also began to stabilize: rising demand amid global economic recovery led to increased investment in US shale oil fields. As a result, from 2005 to 2013, production increased from 5.18 million to 7.44 million barrels per day.
A local equilibrium emerged in the market and overall reduction in volatility of crude oil and instruments correlated with it, such as petro-currencies. Investor uncertainty after the completion of the next QE stage was also reflected in the market for “safe haven” assets, such as gold and silver. Withdrawal of funds from “safe havens” to active equity and debt markets slowed down. As a result, from January 30, 2012, to December 10, 2013, the position portfolio based on stock indices and commodity instruments found itself in a zone of uncertainty.
It should be noted that during this period, the highest demand was for the lowest-risk investments – fixed-rate securities, real estate, and bank deposits. Since none of these assets were included in the portfolio, the period of low volatility inevitably affected the return curve. Nevertheless, overall, for the entire period considered, the instrument’s return was 116% with a maximum drawdown of 11%. Thus, the estimated investment profitability exceeded 10.5 over 4 years.
Fundamental Basis of the Portfolio Spread Trend
The upward trend observed on the portfolio value chart has long-term fundamental grounds.
Oil Market Supply Growth
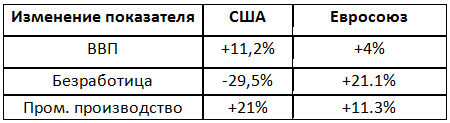
First, according to a Morgan Stanley report, from 2012, US companies reduced the cost of shale oil production by $30 per barrel for light WTI oil. In the last three years, shale oil has provided almost all production growth in the US and a large part of global growth. Contrary to analysts’ expectations, on November 27, 2014, OPEC decided not to change oil production quotas and not to regulate supply in the market. The global trend was reflected in petro-currencies, which are part of the quoted section of the combined portfolio. For example, if from November 2014 (OPEC meeting) Brent lost 16% of its value, then the Canadian dollar and Norwegian krone lost 12% and 17%, respectively. The magnitude of the decline was comparable due to the high correlation (91% and 96%) of the instruments with the underlying asset – Brent crude oil. The decline in energy prices contributed to the growth of major stock indices and the inflow of aggressive investments into capital markets. Confidence was added by positive data on the recovery of the US and EU economies (see the table below). At the same time, the restraining role of high unemployment in EU countries could not be ignored.
Decline in Demand for Precious Metals
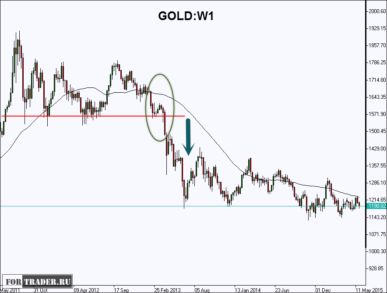
The recovery of developed economies and capital outflows from low-risk segments led to a decline in demand for precious metals and gold, as the basic “safe” asset. On the weekly gold (spot) chart, a moving average based on the last thirteen bars is added.
It can be noticed that at the end of 2012 – the shale revolution, winding down of the penultimate QE stage – a trend reversal was marked. Optimism and appetite for risk returned to investors. As a result, demand for conservative, but low-yield assets naturally declined. From February 25, 2013, the spot price of gold lost 24%, the Australian dollar fell by 25%, and Rio Tinto Group shares lost 18% of their initial value. The magnitude of deviation was comparable for the base asset (gold) and its “derivatives”.
Risks
The growth of stock indices and decline in demand for commodities is the leitmotif of the era of recovery of developed economies. Nevertheless, due to high unemployment in the EU, the main stable growth engine remains the US economy, which has a traditional vulnerability – high debt burden. Since 1976, the United States has had a negative trade balance. The debt-to-GDP ratio is 122.7%. Moreover, the debt burden is growing faster than per capita income and GDP (see the figure below). This means the economy is unstable against deflationary risks, and investors may “lose optimism” at the slightest sign of slowing growth.
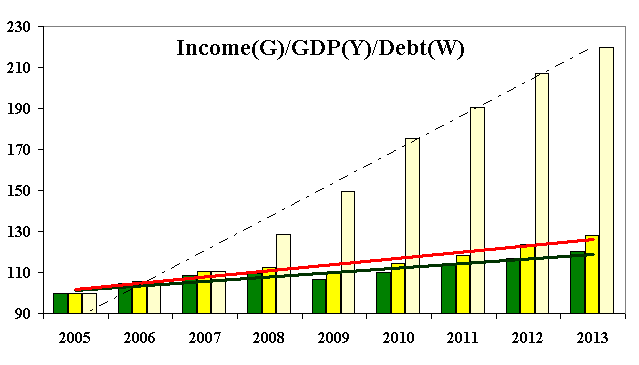
GDP (yellow) and government debt (white)
The most dangerous moment for portfolio return growth is the planned increase in the US base lending rate, scheduled for early autumn 2015. This event could cause a reduction in lending to small and medium businesses and slow economic growth both within the country and abroad.
Strategy for Managing the Combined Investment Portfolio
You can open portfolio positions using a separate platform. In this case, the NetTradeX interface is only a means of displaying the portfolio value. As a convenient alternative, positions can be opened directly within NetTradeX in the standard way (see the figure below).
In the “volume” field of the position, specify the volume of the base or quoted parts (it does not matter, as these volumes are equal).
- Portfolio management can be passive holding over the recommended horizon (1-2 years), or until a qualitative change in the fundamental situation;
- Active portfolio management can also be used, based on periodic rebalancing of weights. The share of assets can be changed based on fundamental outlook or the capital asset pricing portfolio theory (CAPM model), which was used in calculating this portfolio;
- Active portfolio management implies the application of a trend-following strategy – positions are opened in the direction of the trend movement. As an example, consider buying the portfolio when crossing the Bill Williams fractal (any traditional indicator can be attached to the portfolio value chart in the NetTradeX platform). We will limit ourselves to the simplest marker of the most significant highs/lows. Risks can be limited by the current fractal minimum. In this case, three growth periods are observed, which together allow achieving a return of 10% per year. Controlled risk is a pleasant bonus – a maximum of 2% of invested funds. Thus, active management shows higher profitability R=10/2=5 compared to its passive counterpart R0=2.6.