


Candlestick analysis has remained a popular method for analyzing currency markets and other financial assets for over 200 years. Developed by Japanese traders, it continues to prove its effectiveness today and is widely used by traders worldwide. Candlestick patterns consist of combinations of 1 to 5 market bars that, when analyzed correctly, can forecast future price movement.

Candlestick patterns are successfully applied across various asset classes including stocks, cryptocurrencies, commodities, and derivatives. The reason for their widespread use lies in their ability to represent the fundamental principles of supply and demand, bullish and bearish forces, that are common across all markets. Candlestick patterns reflect trader emotions and trend phases, which differ mainly in the speed at which they develop.
Contents
- How to Trade Using Candlestick Analysis
- Candlestick Patterns in Practice
- Indecision Candles in Forex
How to Trade Using Candlestick Analysis
To trade forex patterns using candlestick analysis, you need only a price feed for your chosen instrument. The market bars and their formations serve as the indicators themselves. This approach is especially convenient on higher timeframes for longer-term trading, when you only need to check your terminal once per day.
Using candlestick analysis in trading is straightforward—you need to know the pattern itself and its implications: whether it signals trend continuation or reversal. Open trades only after the final candle of the pattern closes to avoid false signals.
Stop-loss levels are placed according to specific rules for each candlestick pattern. Generally, for reversal patterns, the stop-loss is placed at the lowest point of the pattern; for continuation patterns, it is placed at the highest point.
This article presents a list of interesting and mostly unconventional candlestick patterns with brief trading recommendations. If you decide to use them, we recommend studying the mechanics and economic logic of each individual pattern in depth.
Candlestick Patterns in Practice
Many different candlestick patterns exist in the markets—modern ones and quite ancient patterns that were identified during the early development of financial markets. We have selected the main patterns you are likely to encounter. There are 31 in total, so this article is divided into several sections.
Each list of candlestick patterns complements the others, so you can begin studying and applying them today, starting with this article. You can then deepen your knowledge of candlestick analysis with each new publication.
For convenience, we have divided the patterns into continuation patterns, where you enter the market in the direction of the overall trend, and reversal patterns, where you anticipate the start of a correction or trend change.
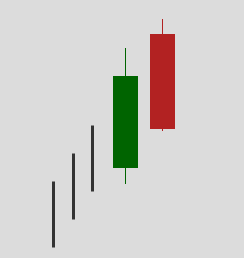
In this article, bullish candles are shown in green and bearish candles in red.
Indecision Candles in Forex
This candlestick pattern is theoretically the only one that requires just a single bar for analysis and price forecasting.
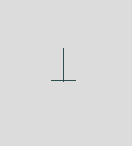
1. Doji
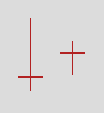
The Doji is one of the most unusual market situations. It is a candle where the opening price equals the closing price. The size of the wicks can vary. The result resembles a cross, inverted cross, or plus sign.
The appearance of a Doji in candlestick analysis signals market indecision. Bulls and bears are in a tug-of-war, with neither side gaining control. A Doji candle indicates a potential reversal setup, especially when followed by a strong opposite candle (Morning Star or Evening Star pattern). Place extra emphasis on Doji patterns forming at key support or resistance levels, trend exhaustion points, or historical reversal zones. Multiple Dojis forming in succession (such as the Tri-Star pattern) further strengthen the likelihood of a reversal.
Reversal Candlestick Patterns
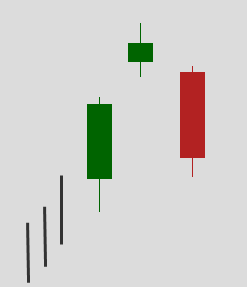
2. Abandoned Baby
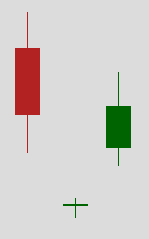
A rarely occurring reversal pattern where a Doji candle is surrounded by two gaps in opposite directions. The wicks of the Doji must extend beyond the wicks of the neighboring candles.
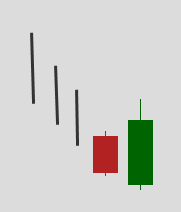
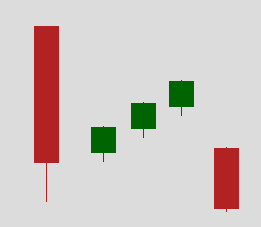
3. Dark Cloud Cover
A bearish reversal pattern in candlestick analysis. The first candle is bullish with a large body. The second candle is bearish, opening above the high of the previous candle and closing below the midpoint of the previous candle’s body.
This pattern often appears at the end of sharp, rapid moves following news releases, when all positive sentiment has been exhausted.
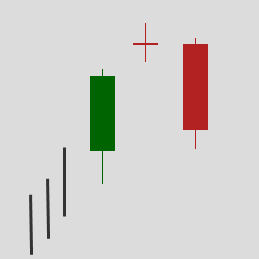
4. Dragonfly Doji

A Doji candle with a long lower wick and virtually no upper wick. This pattern is one of the signals for trend reversal. Bulls no longer have the strength to break above the opening level and continue higher. The signal strengthens if a large bullish candle preceded the Doji.
5. Gravestone Doji
<img class="alignnone size-full wp-image-166016" src="https://files.fortraders.org/uploads/2015/07/gravestone-doji-
FAQ
What is a Doji candle?
The Doji is a single candlestick where the opening price equals the closing price, forming a cross-like shape that signals market indecision between bulls and bears.
What is the Dark Cloud Cover pattern?
Dark Cloud Cover is a bearish reversal pattern with a bullish candle followed by a bearish candle that opens above the prior high and closes below its midpoint, indicating exhausted buying pressure.
How should candlestick patterns be used in trading?
Use candlestick patterns with confirmation from volume, support/resistance levels, or other indicators; place stop-losses at pattern extremes and enter trades after the final candle closes.


