


Master Class ‘Algebra of Financial Trading.’
When developing a mechanical trading system, the first step is to set yourself a goal, realize what you want to achieve, and determine the style of play that suits you. Both your actions and the results must be as formalized as possible. However, theory often consists of lengthy discussions that resemble the prophecies of the Delphic oracle because they can be interpreted in both directions.
Read the article in PDF journal ForTraders.org
Capital Management
All conclusions regarding the direction of the expected price movement are based on oscillators and indicators, which are built on averaging historical data. Their value is at least questionable, since price movements fit well within a Markov process, which has almost no memory. Capital management remains the only option. The maximum that technical analysis offers in this area is limiting losses to 2% by placing a stop-loss (A. Elder). The simplicity of this postulate, in my opinion, does not even need discussion. The only advantage is the ease of calculations, but even this is rarely performed by traders, and often not done at all. Let’s try to consider capital management methods based on the obtained averaging algorithm. Using basic algebra, we will expand the numerator brackets and divide the numerator term by term by the denominator value. This is done based on the following considerations. If in the first case we have a formula in a form convenient for differentiation, performing the above operations simplifies it for clarity and allows us to consider it as a function from Pn. Indeed, within the current iteration, all variables of this formula can be considered as constants, except for Pn. This will allow us to consider the resulting expression as a functional dependency. Omitting all intermediate steps in the derivation, we get the following result.
n = (D-2* N)/ Pn + (2*N- D/ PN), where
D – the deposit you have;
PN – the price corresponding to the already opened volume;
N – total volume;
Pn – current price;
– the volume with which we can safely open.
In the resulting expression, we have a function and an argument Pn. All other quantities, at the moment, within this iteration are constants. But the resulting expression is a hyperbola known to us from the school algebra course of the fifth grade, which can be easily represented on a graph, since all constants define only the shift and expansion of the hyperbola relative to the x-axis and y-axis, so they can be ignored. Obviously, no one suggests building a graph after each iteration. It is enough to realize that the game result becomes predictable as long as our actions correspond to the obtained hyperbola. Thus, we can conclude that constant profit is quite real if we ‘ride’ the hyperbola and do not intend to deviate from it. However, the branches of the hyperbola go to infinity, so it is necessary to introduce some limitations. First of all, this relates to the total volume of open positions.
Calculating the Total Volume of Open Positions
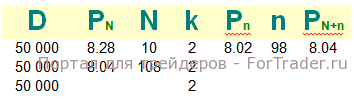
In the previous article (see Issue 71 of the ForTraders.org magazine – ed.) I promised to show a way to determine N. It is not complicated. It is enough to choose the daily investment horizon and determine the trend direction. If we assume that we are playing upwards, then the maximum price value corresponds to the zero initial volume. With some pullback, i.e., a downward movement, we get the volume that needs to be opened. It is best demonstrated in Excel with a real calculation example. First, transfer the main formula, and take the deposit and all other variables arbitrarily. It will not be related to the real market, since we also take an arbitrary asset. As a result, Excel should look like this. In the first row, place accordingly:
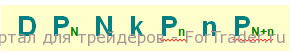
where all letter values are already known, and new notations will be only k and PN+n. k is default equal to 2, since we use only half of the market gift, and PN+n – formed as a result of the performed iteration general average entry. After placing the table “header”, it is necessary to place the formula. Under D place an arbitrary number that will correspond to the supposed used deposit, let’s say 50,000, regardless of dollars, pounds, rubles, escudos, tugriks. Under PN place again an arbitrary price of the asset, say 8.28. Under N – the volume that is already working. Let it be equal to 10 shares. About k, equal to 2, I have already spoken. Under P place the price that has formed at the current moment and waits for our actions. Since we are playing up, and the rate is presumably going down, we put a lower price than before. Let this price be equal to 8.02. Then in cell F2, located under , , place the formula itself, which for work in Excel will look like ((A2-2*C2*B2)*(B2-E2))/(D2*B2*E2), and the resulting result in cell F2 will be 98 shares. Of course, the amount will be obtained fractional, but buying less than one share is impossible, so Excel is set up so that rounds the returned value. The same applies to other values.
The price, for example, is rounded to two decimal places. Of course, you can round manually, but why add work to yourself if everything can be done automatically? We have one cell G2 left unfilled, which is under PN+n. This cell should contain the value of the new average entry considering the purchase of 98 shares at a price of 8.02. The algebraic formula will be the following. It was already mentioned in the previous article, but I will remind you anyway.
P(N+n) = (N*PN+n*Pn)/(N + n)
And in tabular form it will look like this (B2*C2+E2*F2)/(C2+F2), the returned value will be 8.04 and it should be moved to cell B3, since this is the new price of our market entry. However, the number of purchased shares will also change and will be the sum of adding 10 and 98 shares, which is entered into the corresponding cell.
<img class=”alignnone size-full wp-image-
FAQ
What is the purpose of the averaging algorithm in trading?
The averaging algorithm helps manage capital and determine the volume of trades based on price movements and deposit size.
How is the total volume of open positions calculated?
The total volume is calculated using a formula that considers the deposit, current price, and previous average price, allowing for predictable profit if followed.
Can the algorithm be applied practically?
Yes, by using tools like Excel, traders can apply the formula to real or arbitrary market data for decision-making.


