The MACD (Moving Average Convergence Divergence) is a popular technical analysis tool used to identify trend direction and momentum. It consists of three main components: the zero line, the histogram, and the signal line.
Contents
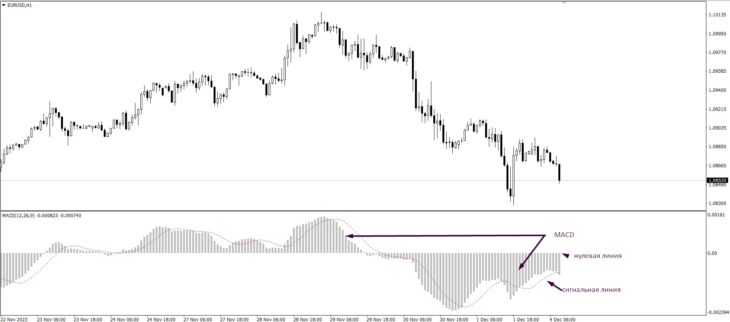
The MACD indicator visually consists of three main parts:
- Zero line
- Histogram
- Signal line
How MACD Works
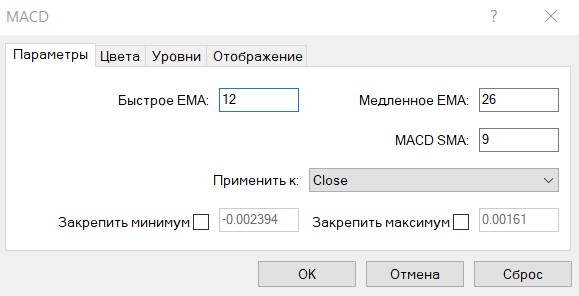
The basic understanding of how the MACD works is based on the interaction between the fast and slow moving averages defined in the indicator settings.
- If the fast moving average is above the slow moving average, the MACD histogram will be above the zero line, indicating an uptrend.
- If the fast moving average is below the slow moving average, the MACD histogram will be below the zero line, indicating a downtrend.
The signal line of the MACD is a moving average of the main line. When the main line crosses the signal line, it can indicate a change in the trend. However, in practice, crossing the signal line by the histogram often generates a potential trade entry, but it should only be taken in the direction of the current trend, which is determined by whether the histogram is above or below the zero line.
How to Trade with MACD
This oscillator is commonly used in trading to identify entry points. Let’s look at the main signals it can provide:
Trend Direction and Entry via the Signal Line
You already know that the trend is determined by whether the histogram is above or below the zero line. Using the signal line helps find a specific entry point within the trend.
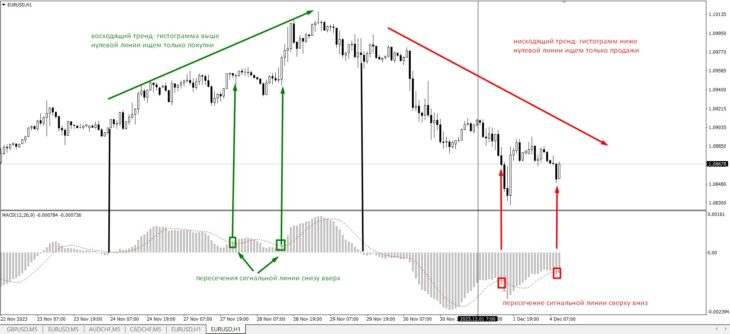
- If the signal line crosses the histogram from below during an uptrend, it is a buy signal. Reverse crossings during an uptrend are ignored.
- If the signal line crosses the histogram from above during a downtrend, it is a sell signal. Reverse crossings during a downtrend are ignored.
Overbought/Oversold Conditions
Unlike many oscillators, the MACD does not have predefined overbought or oversold levels. These levels help traders identify when an asset’s price has reached a significant level and is likely to revert to the mean, in this case, the zero line.
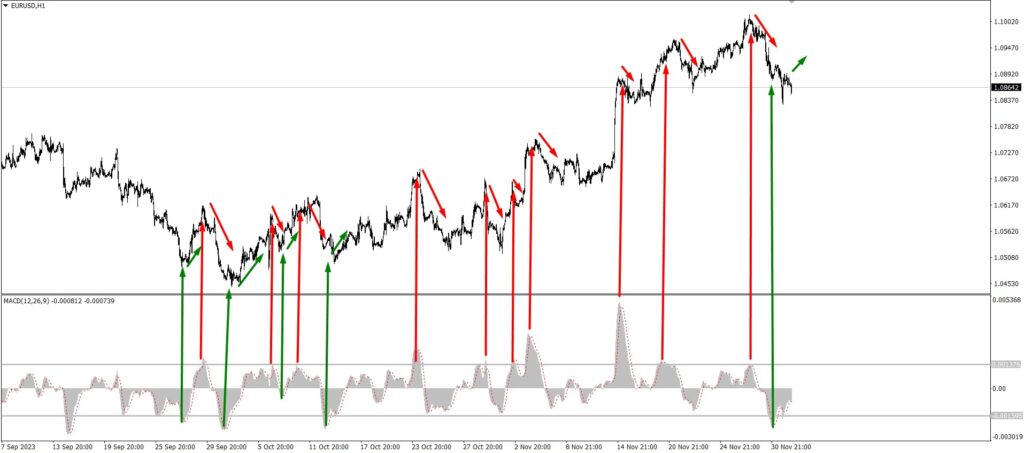
To use MACD as an oscillator, you need to manually draw these levels. To do this, zoom out the chart on the working window and visually determine the peak levels of the histogram from which there were the most reversals.
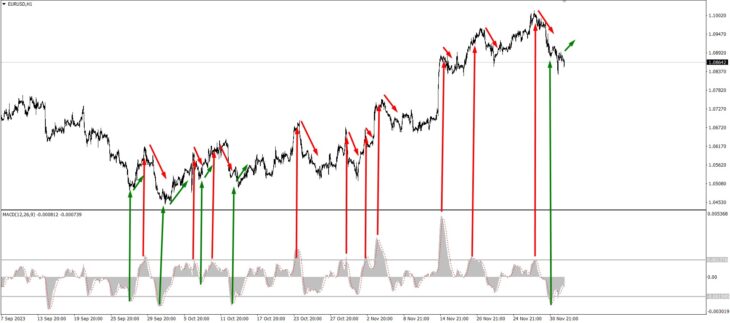
On the EUR/USD hourly chart example, these levels are 0.001397 and -0.001595. As seen in the example, every time these levels were reached, the price returned to the zero line, allowing for interesting entries.
This trading strategy is counter-trend, requiring careful attention from the trader. The entry point can be the second or third bar of the histogram in the opposite direction after reaching the stated level. The goal is for the histogram to reach the zero line.
MACD Divergence
Divergence generally means that when the price makes a new high, the MACD histogram does not, and vice versa when the price makes a new low, the histogram does not. This shows discrepancies between the movement of the asset’s price and the MACD histogram.
Such discrepancies may indicate weakening trends and corrections or potential price reversals. However, it is difficult to determine exactly what the asset will do during divergence.
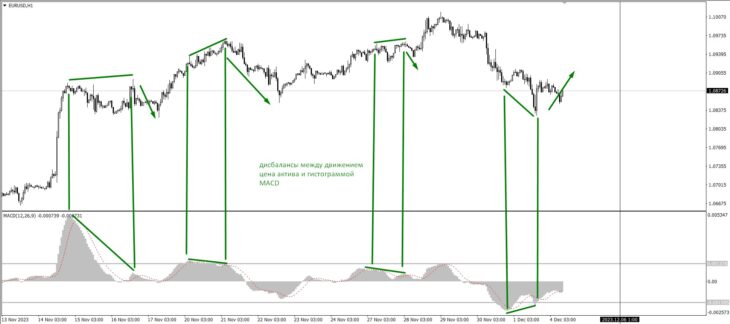
Typically, the divergence signal is used to lock in profits from current trend positions, while the appearance of a reverse signal indicates a potential for re-entry into the trend.
Breakout Trading
This is a complete trading strategy. Its basis is a recurring pattern of continued movement after a breakout of the first peak formed below the zero line.
After the histogram passes the zero line, wait for the first peak to form. Then draw a level on it and wait for the histogram to close below it. After that, you can place pending orders on the price chart to enter in the direction of the breakout with a stop loss below the signal candle.
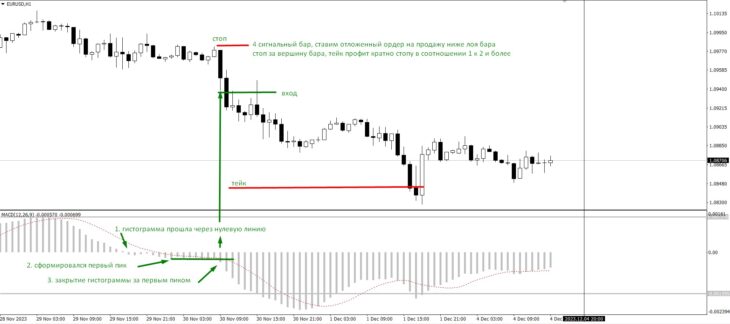 Fig. 6. Trading technique for break
FAQ
What does the MACD indicator show?
The MACD indicator shows trend direction and momentum through the interaction of moving averages and a histogram.
How is a trade entry identified with MACD?
A trade entry can be identified when the signal line crosses the histogram, typically in the direction of the current trend determined by the histogram’s position relative to the zero line.
What is MACD divergence?
MACD divergence occurs when the price and the histogram move in opposite directions, indicating potential trend weakness or reversal.