In issue 9 of ForTraders.org, we will examine the long-term trading strategy called ADX & MA. To implement this strategy, we need two indicators: ADX and MA.
Forex Trading Strategy Algorithm
Instrument: EURUSD;
Timeframe: Daily;
Trade Volume: 0.1 lots;
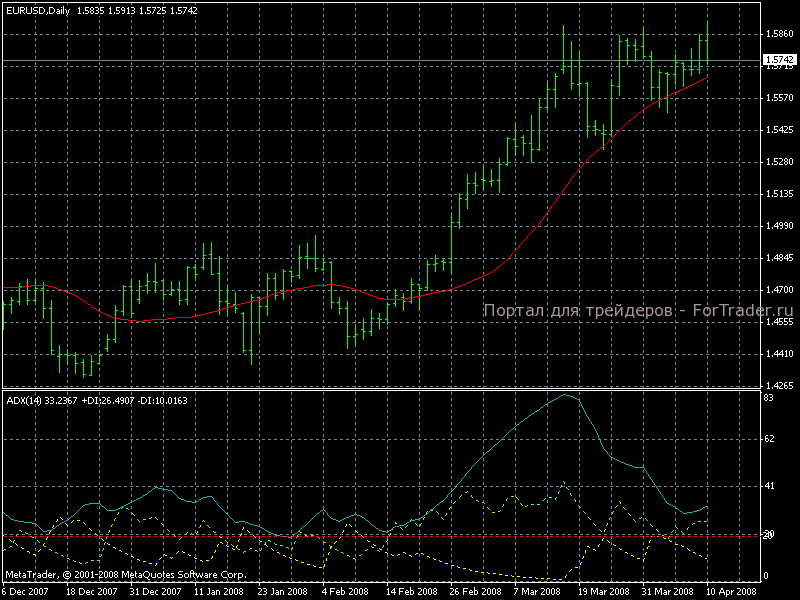
ADX Indicator with a period of 14, mark the level 20 on the indicator;
MA Indicator with a period of 21.

Buy Signal: The bar closes above the MA and the ADX line is above 20.

Sell Signal: The bar closes below the MA and the ADX line is above 20.

Exit from Positions: In both cases, we will exit when the bar crosses back over the MA line.
Clearly, if we work with the daily chart, the strategy is trend-based, so we are interested in the parts of the chart where the price moves parallel up or down along with the MA indicator.
First, we will test the expert with the described parameters and rules for opening trades, and then try to improve its performance through optimization and rule adjustments.
Testing the Forex Strategy ADX & MA
Testing the above rules between January 11, 2007, and January 11, 2008, we obtained the following results (based on opening prices):
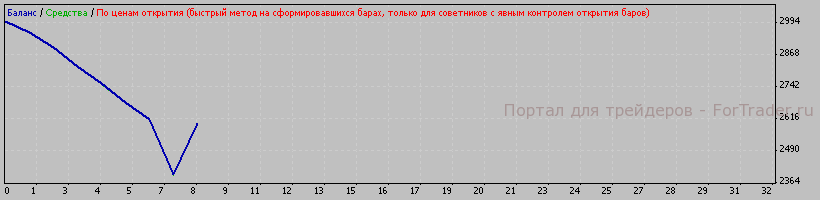
The results were not encouraging, but that was expected, as the rules were too simple, and any strategy requires optimization.
We will try adding parameters and finding the most optimal ones between January 11, 2007, and January 11, 2008, and then test them on future periods up to the present. We added TakeProfit, StopLoss, and TrailingStop, separately for buy and sell orders.
After optimizing the new parameters on the same period, we obtained the following result from the expert:
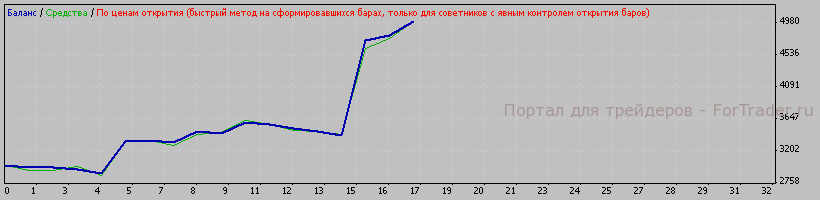
The result was positive and quite good for a year of trading on one currency pair – $2002. By introducing separate TakeProfit, StopLoss, and TrailingStop for buy and sell orders, we were able to further increase profit.
Now, let’s check how these parameters perform on the future period from January 11, 2008, to April 11, 2008.
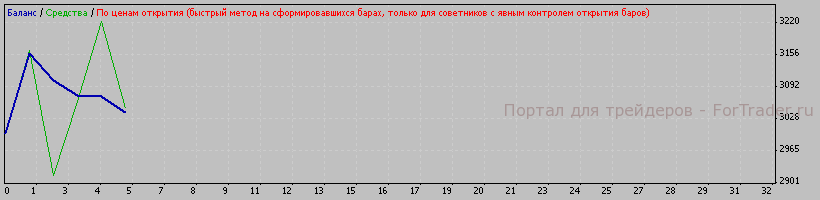
The testing showed that the parameters worked not only on historical data used for initial research but also on other periods. The result over four months was slightly more than $41.
Summary
The strategy is generally functional, but the first thing that stands out is the need to refine the exit rules. In some cases, a stop works well, in others, the reverse crossover, and in some cases, a trailing stop could have been used. We added several new parameters to the expert that were not explicitly mentioned in the strategy, which ultimately improved the results, but there is still a lot of room for development, for example, by testing the expert on smaller timeframes. Good luck.
“,
“excerpt”: “Discover the ADX & MA trading strategy for forex, including setup, signals, and optimization techniques.”,
“slug”: “adx-ma-trading-strategy-for-forex”,
“faq_html”: “
FAQ
What is the ADX & MA trading strategy?
The ADX & MA trading strategy uses the ADX (Average Directional Index) and MA (Moving Average) indicators to identify trends and generate buy/sell signals based on price action relative to the MA and ADX levels.
How does the ADX indicator work in this strategy?
The ADX indicator measures the strength of a trend. In this strategy, a reading above 20 indicates a strong trend, which helps confirm the validity of trade signals generated by the MA.</p