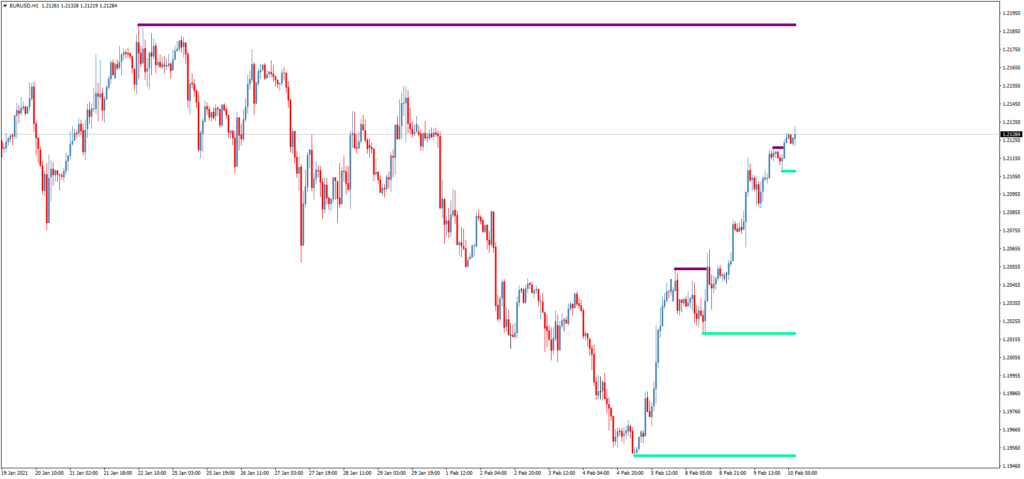
The Support and Resistance MTF Trading Indicator identifies so-called ‘untouched’ price levels of support and resistance that almost always cause a sharp reversal when reached.
With this indicator, you can identify high-probability reversal setups.

How to Use the Support and Resistance MTF Indicator
The author recommends placing the Support and Resistance MTF indicator on the price chart 2-3 times with different time frame settings and candlesLeftRight parameters.
The candlesLeftRight parameter determines which recent highs/lows are detected:
- The default value for the candlesLeftRight parameter is 3.
- If you add the indicator a second time on the price chart, for example, with candlesLeftRight = 6, you will see additional support/resistance levels.
- If desired, you can add the indicator a third time, for example, with candlesLeftRight = 9.
The Support and Resistance MTF Trading Indicator is effective in breakout and bounce trading strategies, as well as for setting take-profit and stop-loss orders.
- Download the Support and Resistance MTF Indicator
Other Profitable Trading Indicators
- Channel Trading Indicator HMA’BB Adaptive MTF
- Trading Indicator Levels Pivot Lines TimeZone
- Universal Trading Indicator iGodZilla
FAQ
What is the Support and Resistance MTF Indicator?
The Support and Resistance MTF Indicator identifies key price levels of support and resistance that often cause sharp reversals when reached.
How do I use the Support and Resistance MTF Indicator?
The indicator should be placed on the price chart 2-3 times with different time frame settings and candlesLeftRight parameters to detect recent highs and lows.
What are the benefits of using the Support and Resistance MTF Indicator?
The indicator helps traders identify high-probability reversal setups and is useful for setting take-profit and stop-loss orders in breakout and bounce strategies.