It can be challenging to determine whether a price break is genuine or just a test of a level. The Mean Reversion Trading Indicator helps identify false breakouts.
As known, prices tend to return to their average value. The Mean Reversion indicator uses this property through a non-standard mathematical approach. It is based on regression analysis, specifically polynomial regression, which forms what is called the ‘center of gravity’ of the price.
The Mean Reversion indicator allows for a high probability of determining whether the price will break a support or resistance level and continue in the expected direction, or move away from it.
How to Use the Mean Reversion Indicator
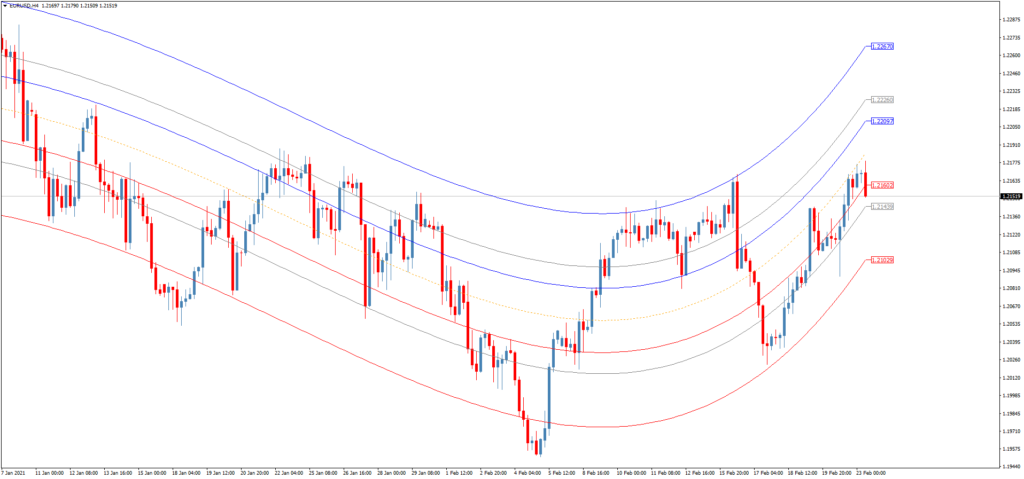
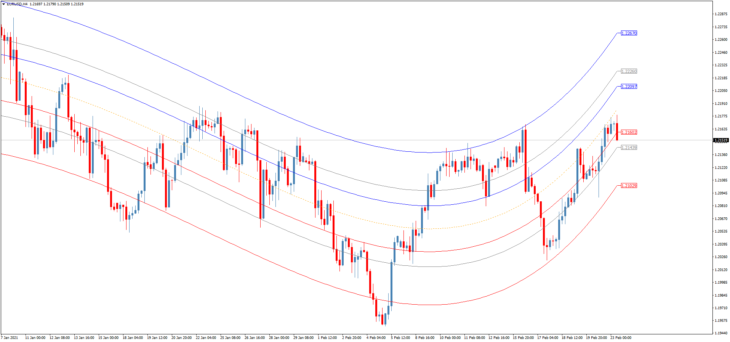
The channel boundaries along with the gray line define overbought and oversold zones. A price touch of the upper or lower boundary is a likely reversal point.
Another way to use the indicator is to determine the exit point from a trade.
Suppose you opened a short position after a downtrend. You need to determine when the trend will end and the price will reverse direction.
A reliable signal in this case is the price entering the oversold zone—reaching the lower boundary of the channel. This means that a bounce is likely, and it’s time to take profit.
Using the same principle, you can open trades on trend retracements. For example, in an uptrend, you enter or add to your position when the price touches the lower boundary of the channel.
- Download the Mean Reversion Trading Indicator
Other Profitable Trading Indicators
- Trend Trading Indicator Period Adaptive MA
- Support and Resistance Levels Trading Indicator MTF
- Channel Trading Indicator HMA’BB Adaptive MTF
FAQ
What is the Mean Reversion Trading Indicator?
The Mean Reversion Trading Indicator is a tool that helps traders identify false breakouts by analyzing price behavior around key levels.
How does the Mean Reversion Indicator work?
The indicator uses regression analysis, particularly polynomial regression, to form a ‘center of gravity’ for the price, helping to identify overbought and oversold conditions.
When should I use the Mean Reversion Indicator?
You can use the Mean Reversion Indicator to determine entry and exit points in a trade, especially when the price reaches the upper or lower boundaries of the channel, indicating potential reversals.